DNS Report
DNS Report
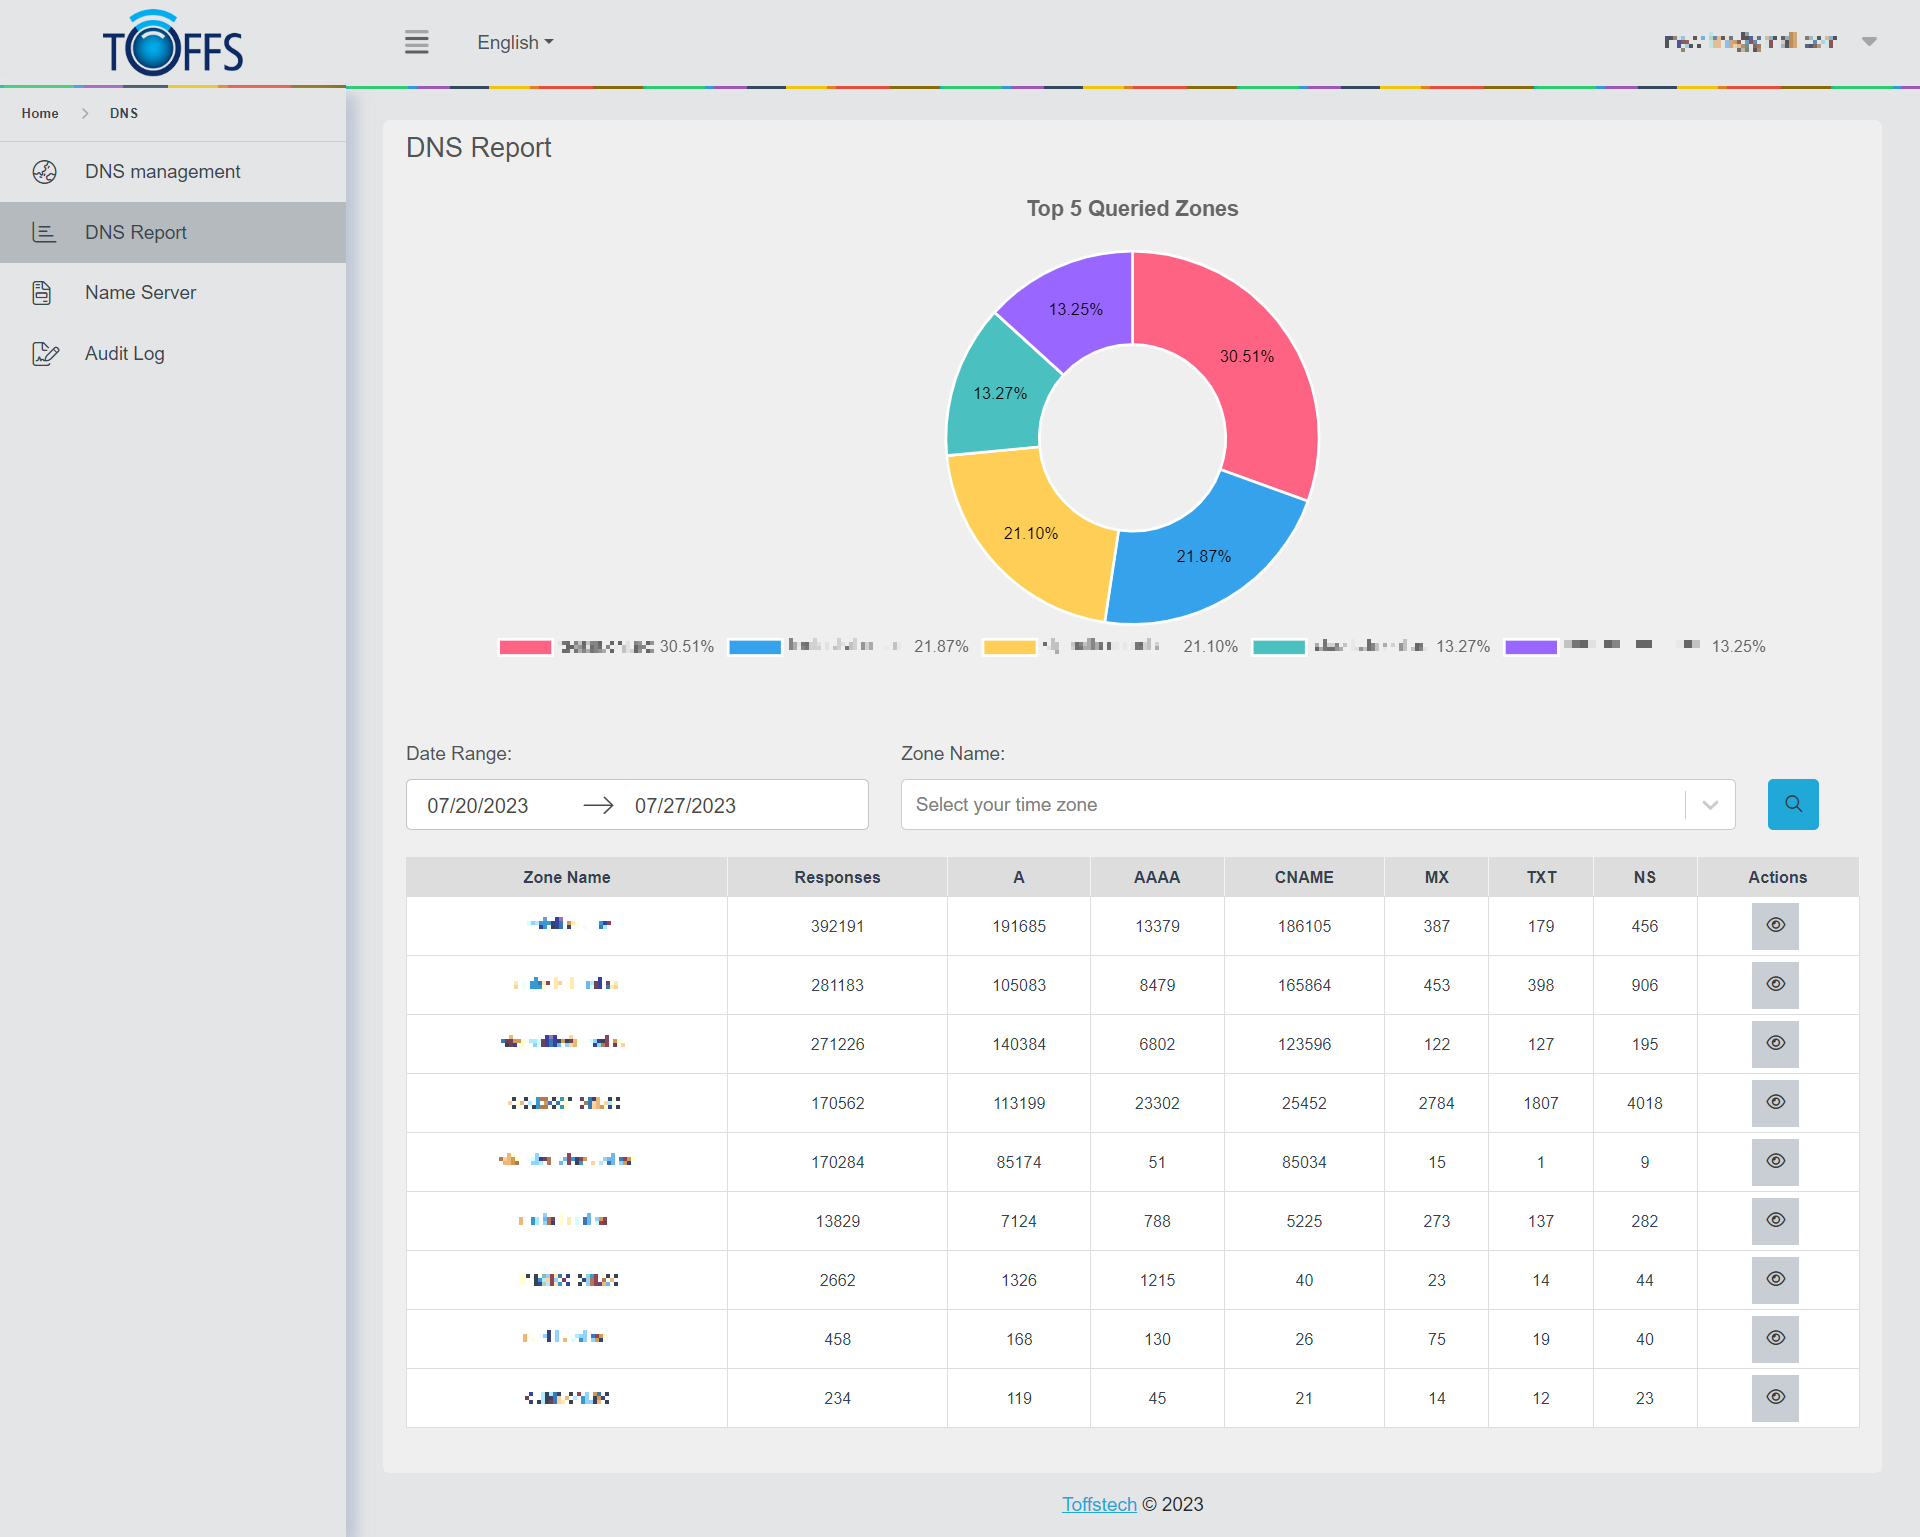
Figure 245
The Query Analytics Report page is comprised of two reports: the Zone Query Response Report and the Host Query Response Report.
The Zone Query Response Report is designed to provide aggregated zone query volumes for multiple zones within your account, which will be displayed by default when clicking on the Query Analytics report from the list of available reports. The Host Query Response Report provides aggregated host query volumes for one or all hosts within a zone. This report is implemented as a “drill down” report, designed to get more granular information on a host basis from the Zone Query Volume Report.
Please note that any report that is submitted using any of the Search and Filters options will be displayed whenever you navigate back to the Query Analytics Report, even if you go to a different section and then come back (until you logout). Otherwise, the default seven-day view will be displayed for either report’s details.
Zone Query Response Report
Upon accessing the DNS Report Page, you will find a comprehensive overview of your DNS data. The page contains various sections to help you analyze and manage your DNS zones effectively. Let’s explore the key features of this report page:
Top 5 Queries Zones: At the top of the page, you’ll see a section displaying the “Top 5 Queries Zones.” This provides a quick snapshot of the most frequently queried DNS zones, giving you insights into the domains generating the most traffic.
Date Range Field: To customize your analysis based on specific time frames, you’ll find a “Date Range” field. Simply select the desired start and end dates to filter the data and focus on the relevant period.
Zone Name Field: Adjacent to the date range field, there is a “Zone Name” field. Here, you can input the name of a particular DNS zone you want to explore. This will refine the report to display only the data related to that specific zone.
Search and Filter Field (Magnifying Glass): The “Search and Filter” field, represented by a magnifying glass icon, enables you to search for specific information within the report. Whether you’re looking for a particular record type or a host name, this feature allows you to quickly locate relevant data.
Zone Name Table: The main section of the DNS Report Page is the “Zone Name Table.” This table presents a summary of various DNS zones, including their respective names and the total number of responses for specific record types:
- A: Number of ‘A’ records (IPv4 addresses) associated with the zone.
- AAAA: Number of ‘AAAA’ records (IPv6 addresses) associated with the zone.
- CNAME: Number of ‘CNAME’ records (canonical names) associated with the zone.
- MX: Number of ‘MX’ records (mail exchange) associated with the zone.
- TXT: Number of ‘TXT’ records (text records) associated with the zone.
- NS: Number of ‘NS’ records (name server) associated with the zone.
View Button: For a more detailed report on a specific zone, locate the corresponding zone name in the Zone Name Table. Adjacent to each zone entry, you’ll find a “View” button. Clicking on this button will take you to a more comprehensive report that provides insights into the individual hosts within that zone. Here, you can analyze specific DNS records, their associated IP addresses, and other relevant details.
By utilizing the DNS Report Page and its various features, you can efficiently monitor, troubleshoot, and optimize your DNS infrastructure. Understanding the top queries, filtering data, and accessing detailed reports for specific zones will empower you to make informed decisions and ensure a smooth and reliable DNS service.
Host Query Volume Report
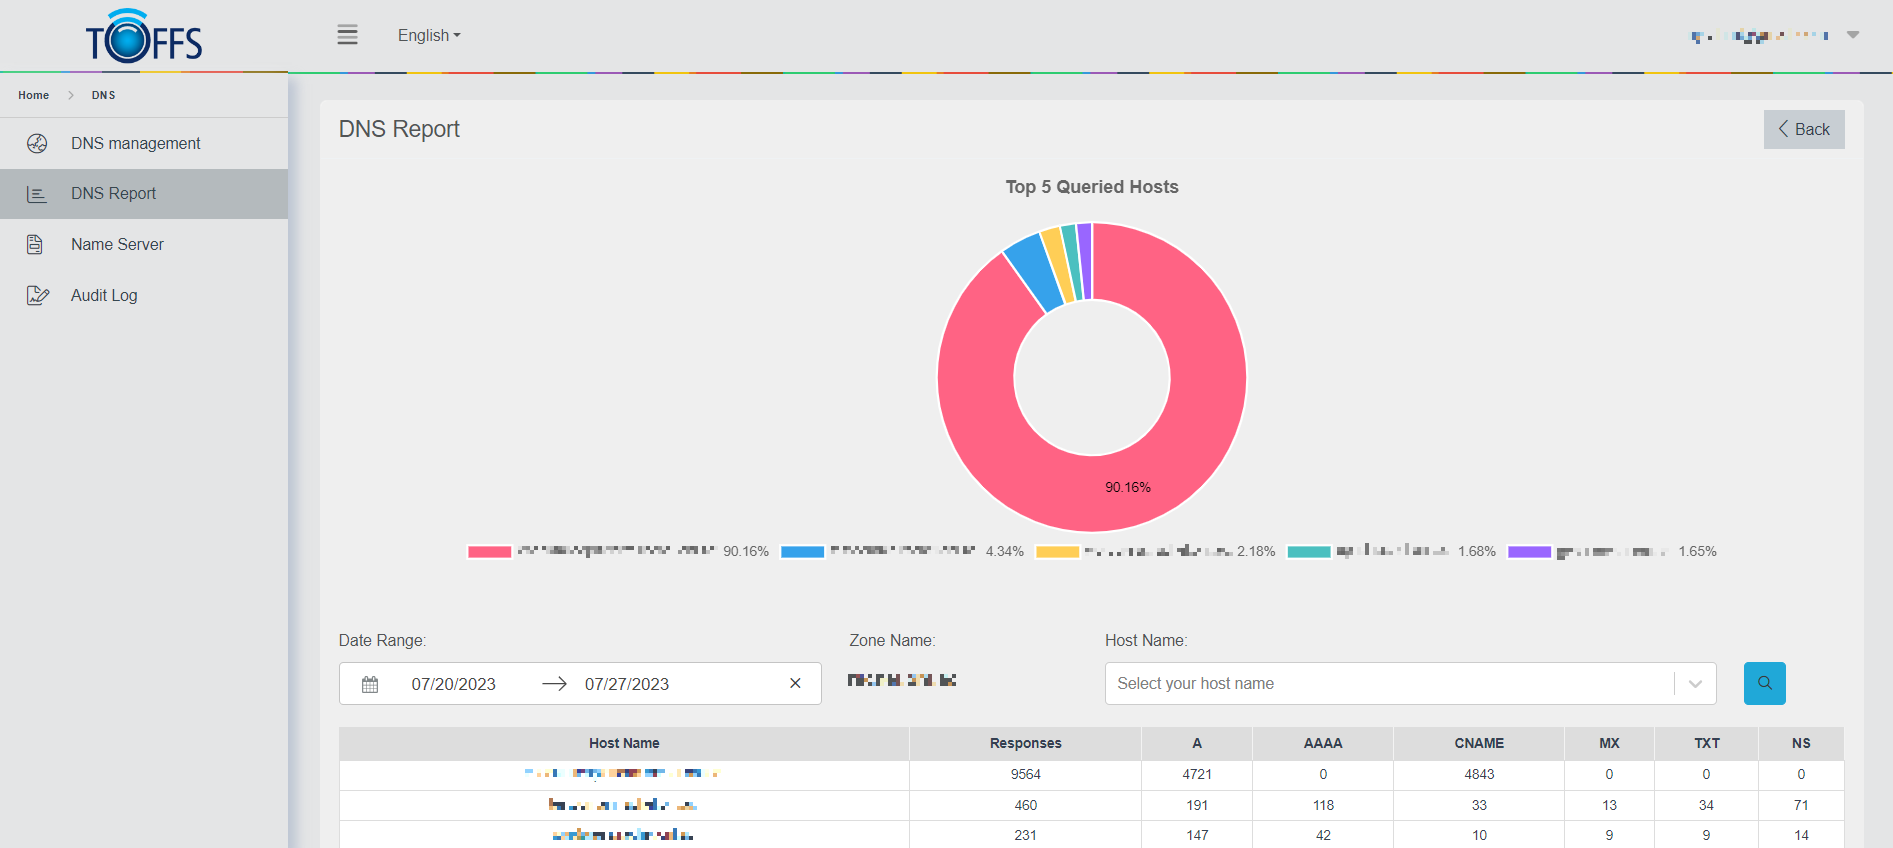
Figure 246
The Host Query Response Report provides aggregated host query volumes for one or all hosts within a zone. This is considered a “drill down” report, as a Zone Name had to be selected from the default Query Analytics – Zone Details table. Clicking on the View (eye) icon from the Zone Query Response Report table for a specific zone will display the Host Query Volume Report details for the selected Zone.
Host Name Selector
The Host Name field allows you to provide the details for a single host name to view the specific details that host. Only one Host Name can be entered at a time in this field.
Please note that the DNS Reports display host details in the following manner:
-
If a Hostname is “defined” (has a record in the domain), and there were no queries during the selected time frame, the host will not appear in the report details.
-
If a Hostname is “undefined” (does not have an active record in the domain), but was queried during the selected time frame, the hostname will appear in the report details.
Similar to the Zone Query Response details page, the Host Query Response details page shows two doughnut charts of data, as well as the Host Name details table. The doughnut charts will display the Host Query details for the selected Host Name from the table, which displays the detailed response count details for the available Host Name(s).
Click the Back button to return to the list of Zones for the selected Account(s).
Please contact Toffs Security Operation Center for assistance if you encounter any issues.