Report Monitoring
Report Monitoring
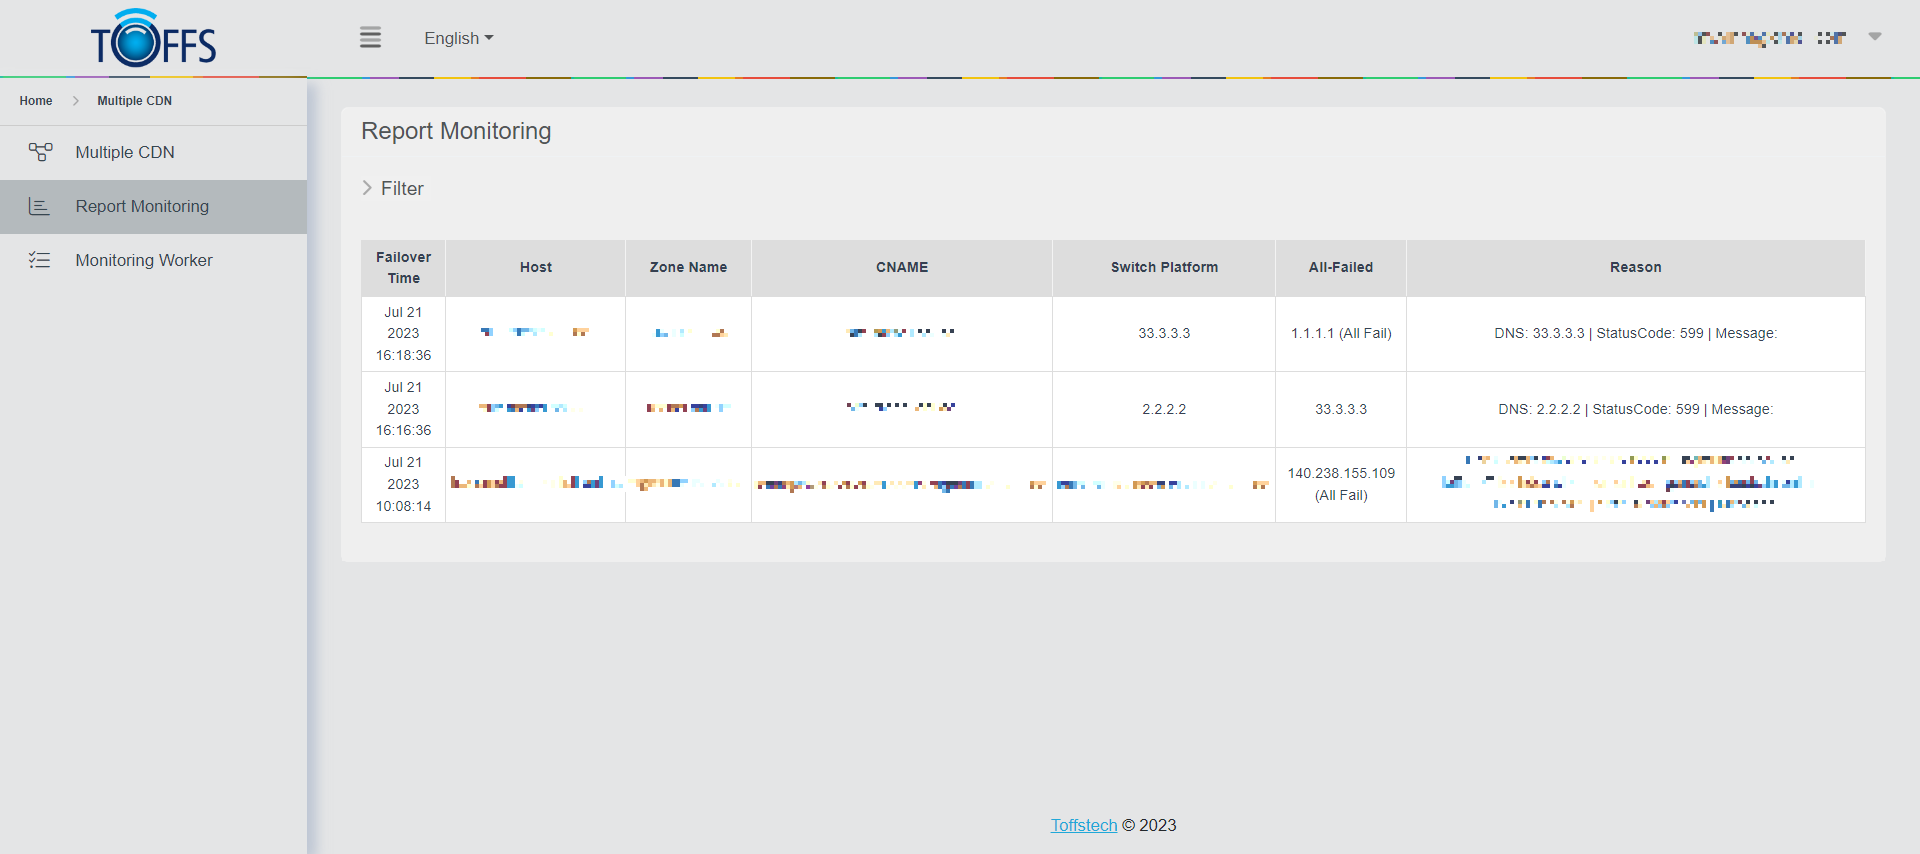
Figure 256
The “Report Monitoring” page is used to check the information of Multiple CDN records, including Failover Time, Host, Zone Name, CNAME, Switch Platform, All-Failed, and Reason. Follow the steps below to effortlessly navigate through the process:
Step 1: Click on the “Filter” Button
First, locate and click on the “Filter” button on the page. The button’s location may vary depending on the design, but it should be easily recognizable.
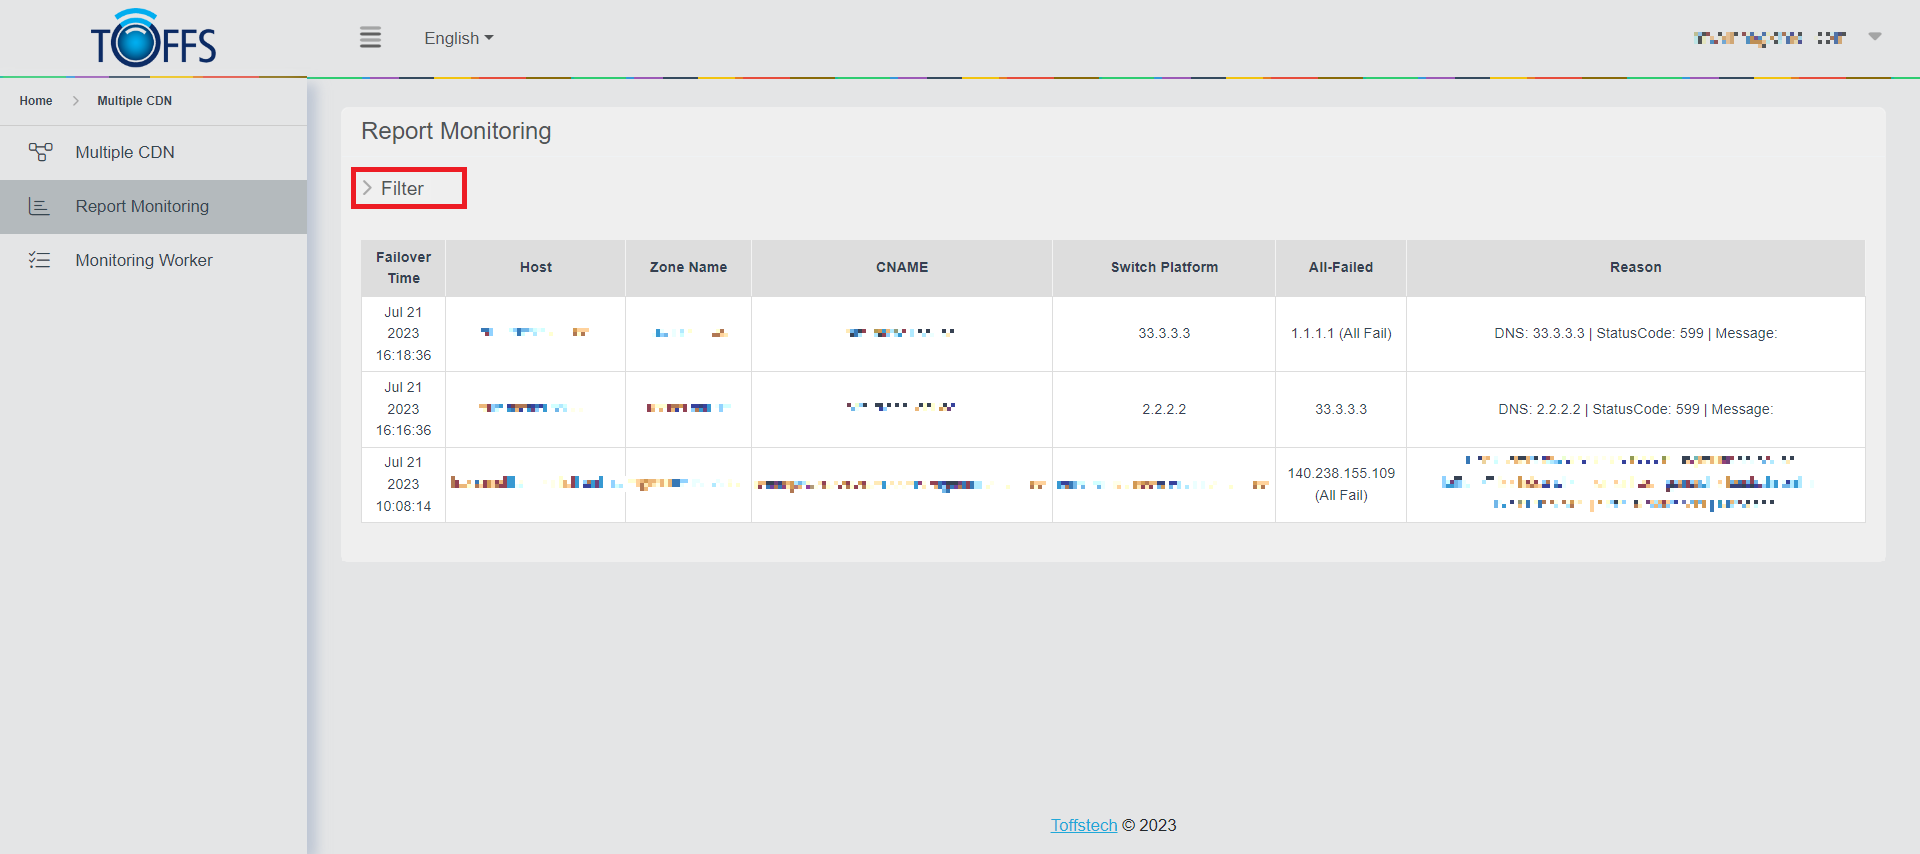
Figure 257
Step 2: Apply Filters to the Data
After clicking the “Filter” button, a filter table will be displayed on the screen. Here, you need to set specific filters to narrow down your search results. Enter the desired Date Range and fill in the Zone Name, Host, and CNAME details accordingly. Once you have entered the required information, click the “Filter” button again.
Step 3: View Filtered Results
Once you’ve applied the filters, the system will automatically process the data based on your selections. The page will then display the relevant information according to the filters you’ve set. This way, you can easily monitor and access the data you need.
By following these simple steps, you can effortlessly utilize the “Report Monitoring” page to check Multiple CDN records’ information.
Please contact Toffs Security Operation Center for assistance if you encounter any issues.