Performance Monitoring
Performance Monitoring
This feature allows users to monitor the performance of a Web, Trace Route and Transactions.
-
Web: This mode test allows checking the availability and performance of a single web page.
-
Trace Route: This mode test analyzes traffic routing and lets the user see performance and packet loss at each hop from node to test server.
-
Transactions: This mode test is similar to a Web test in that it emulates the behavior of a browser accessing a website, but it enables to program a series of interactive steps, such as inputting data in a form, accessing a series of pages, etc.
Performance Monitoring
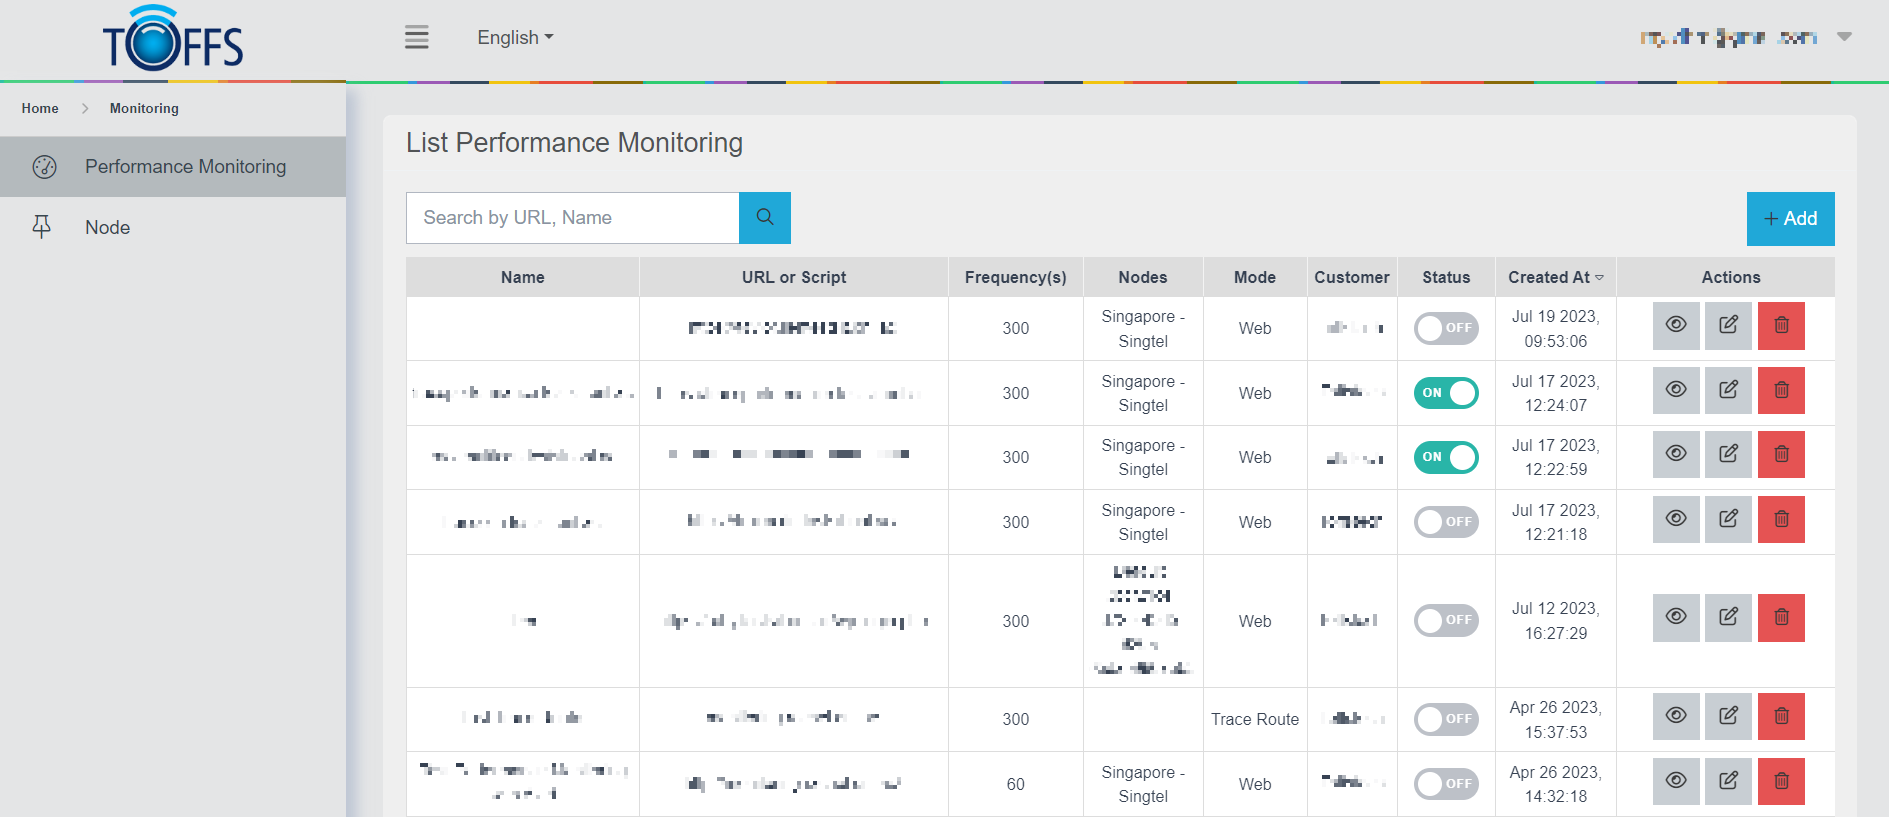
Figure 260
This is the “List Performance Monitoring” page. Here, you can conveniently monitor the performance of a website or trace route. Let’s explore the essential functions:
Adding a Website/Trace Route: To start monitoring a specific URL for its performance, simply click on the “+Add” button. This enables you to input the URL of the Website or Trace Route you wish to check.
Editing Details: In case you need to modify the parameters for monitoring, the “Edit” button comes to the rescue. You can adjust settings such as time intervals, nodes, and IP addresses associated with the selected website/trace route.
Removing Entries: Sometimes, you may no longer need to monitor a particular Website/Trace Route. In such cases, the “Delete” button allows you to remove the chosen entry from the monitoring list.
Viewing Performance: The ultimate goal of this page is to provide you with valuable insights into the performance of your Website or Trace Route. By clicking on the “View” button, you can access the performance metrics and relevant data.
Trace Route
Add Trace Route Mode Test
To begin monitoring the Performance of Trace Route Mode, follow these steps:
Step 1: Accessing the List Performance Monitoring Page
- Go to the “List Performance Monitoring” page.
- Locate and click the “+Add” button to initiate the setup for a new monitoring test.
Step 2: Selecting a Customer
- In the “Select Customer” section, choose a customer from the list based on their name. This customer will be associated with the Trace Route monitoring.
Step 3: Enabling Trace Route Monitoring
- To activate monitoring for the Trace Route test, toggle the “Status” option to the ON position.
Step 4: Entering Monitoring Details
- In the “Name” field, give a descriptive name for this particular monitoring test.
- In the “Mode” field, select “Trace Route” as the desired monitoring mode.
Step 5: Adjusting Frequency (Optional)
- If necessary, you can specify a new value for the monitoring frequency. However, the default frequency is set at 1800 ms.
Step 6: Defining Domain and Nodes
- Provide the domain for which you want to perform the Trace Route monitoring.
- Select the specific nodes that you want to include in this monitoring.
Step 7: Configuring Time Settings
- In the “Time in From” and “Time in To” fields, choose the time range for which you want to conduct the monitoring.
- In the “Time Zone” field, select the appropriate time zone for your monitoring location.
Step 8: Saving the Configuration
- Once you’ve filled in all the necessary details, click the “Save” button to finalize and save the Trace Route monitoring configuration.
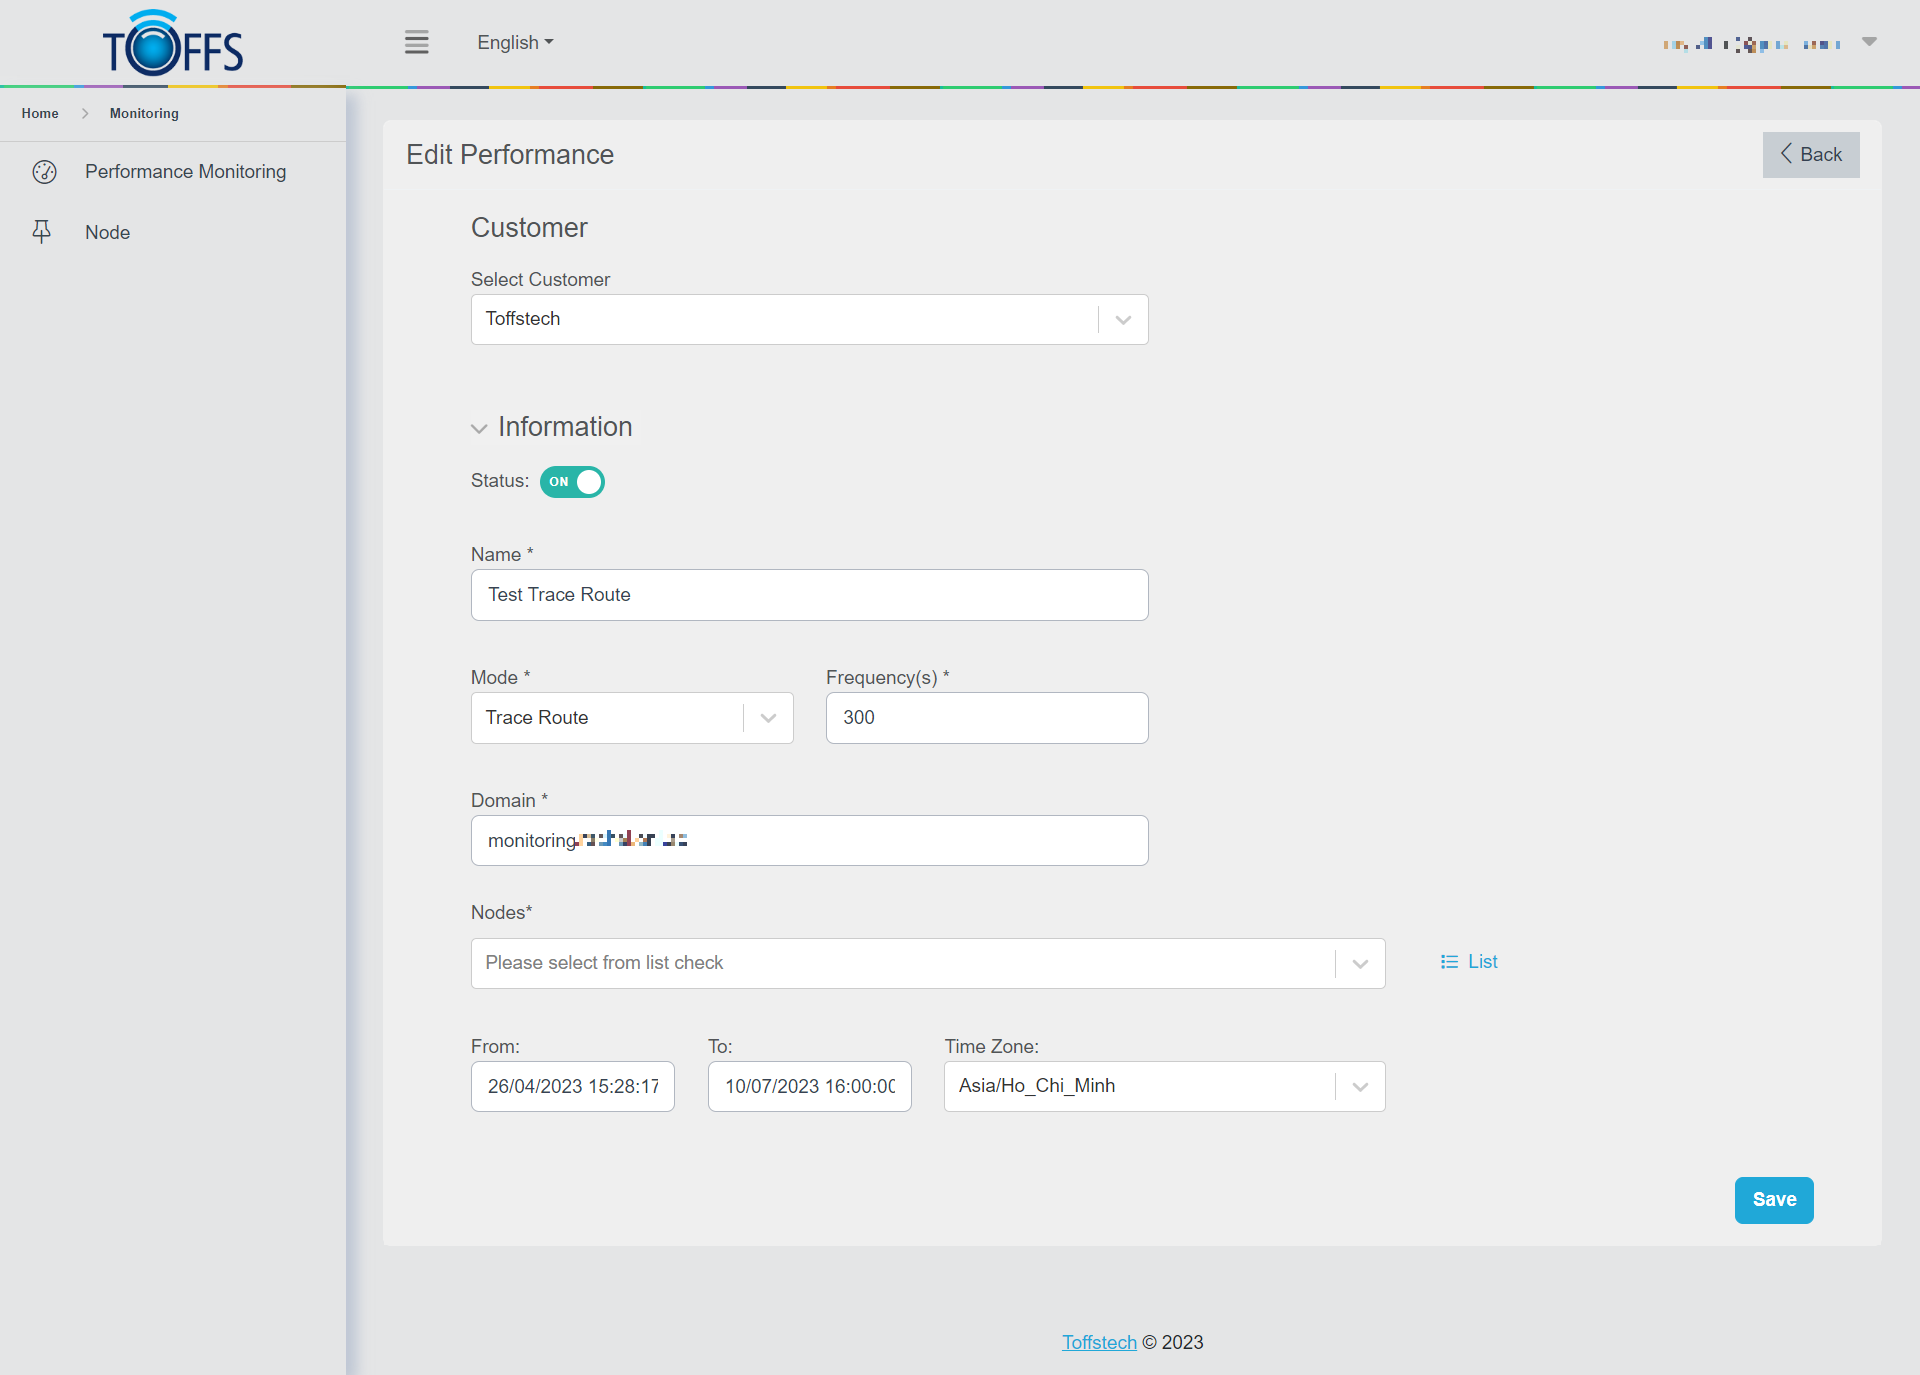
Figure 261
Note: The results might take a few minutes to appear. The system will monitor the specified time range according to the selected time zone and the “From” and “To” fields you’ve chosen.
Check Performance Monitoring of Trace Route Mode Test
Trace Route
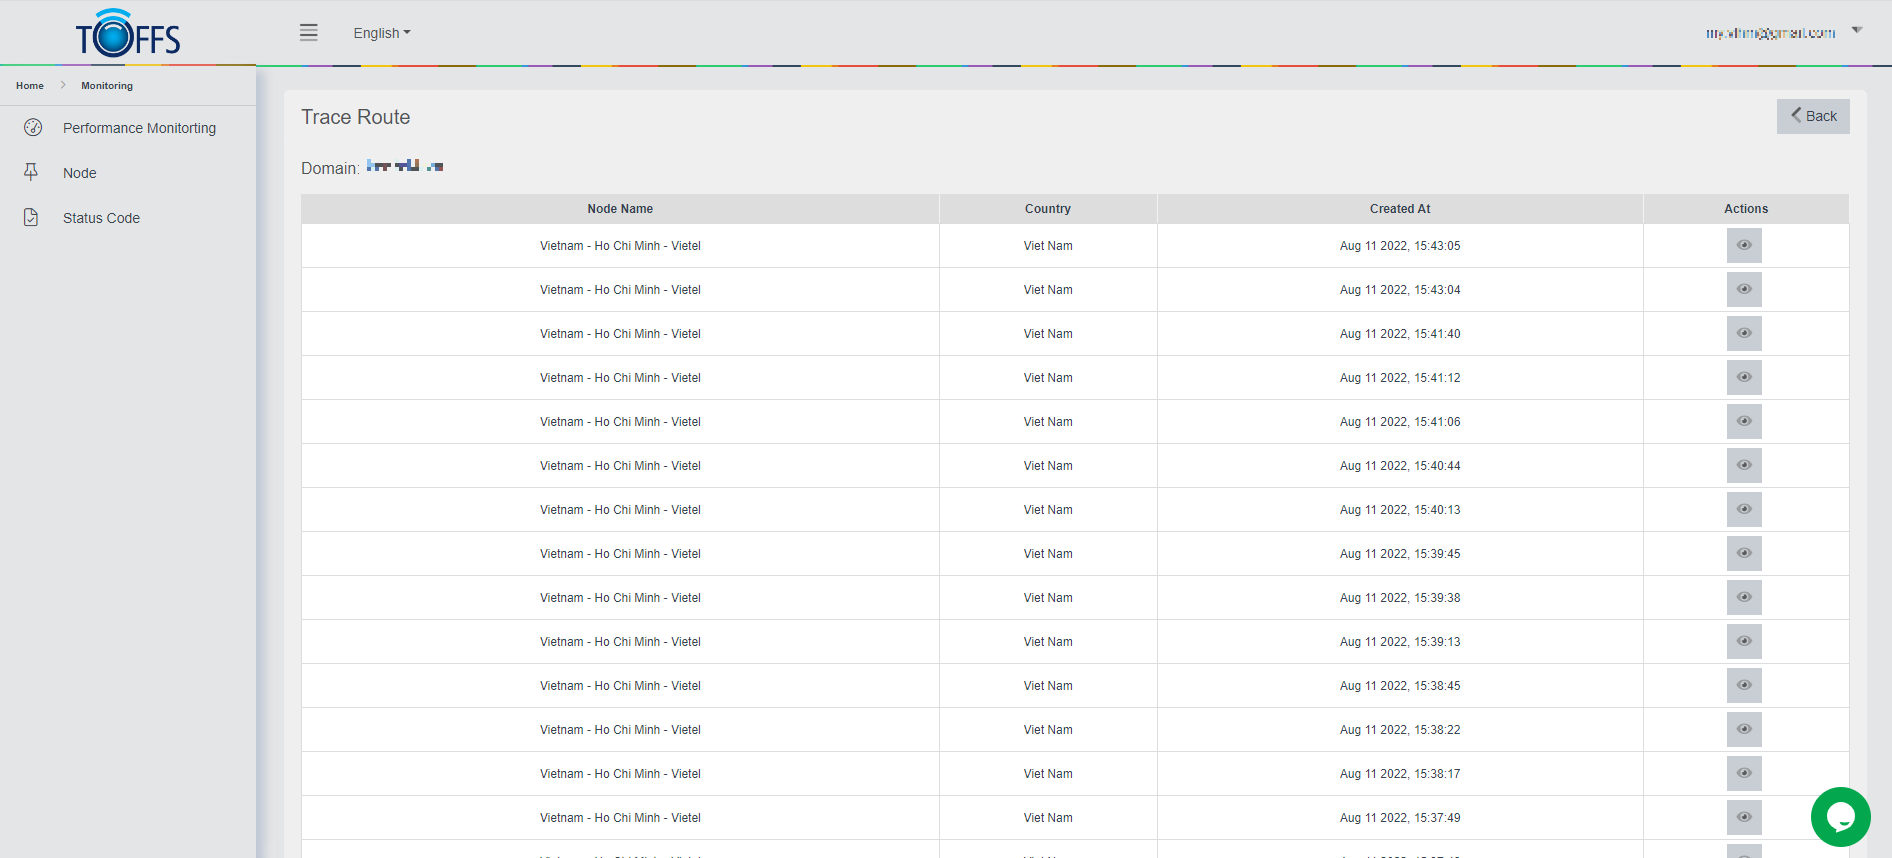
Figure 262
This is the “Trace Route” page. This page will be displayed when you click on the “View” icon at the “List Performance Monitoring” page.
Trace Route, also known as tracepath or tracert, is a valuable network tool utilized to identify the route packets take from one IP address to another.
Within this page, you can observe the precise amount of data calculated and returned to the database. For a more comprehensive view of the data, simply click the “View” button.
If you wish to acquire the detailed Trace Route information for a specific time period, you can conveniently do so by clicking the “Download” button.
Trace Route Detail
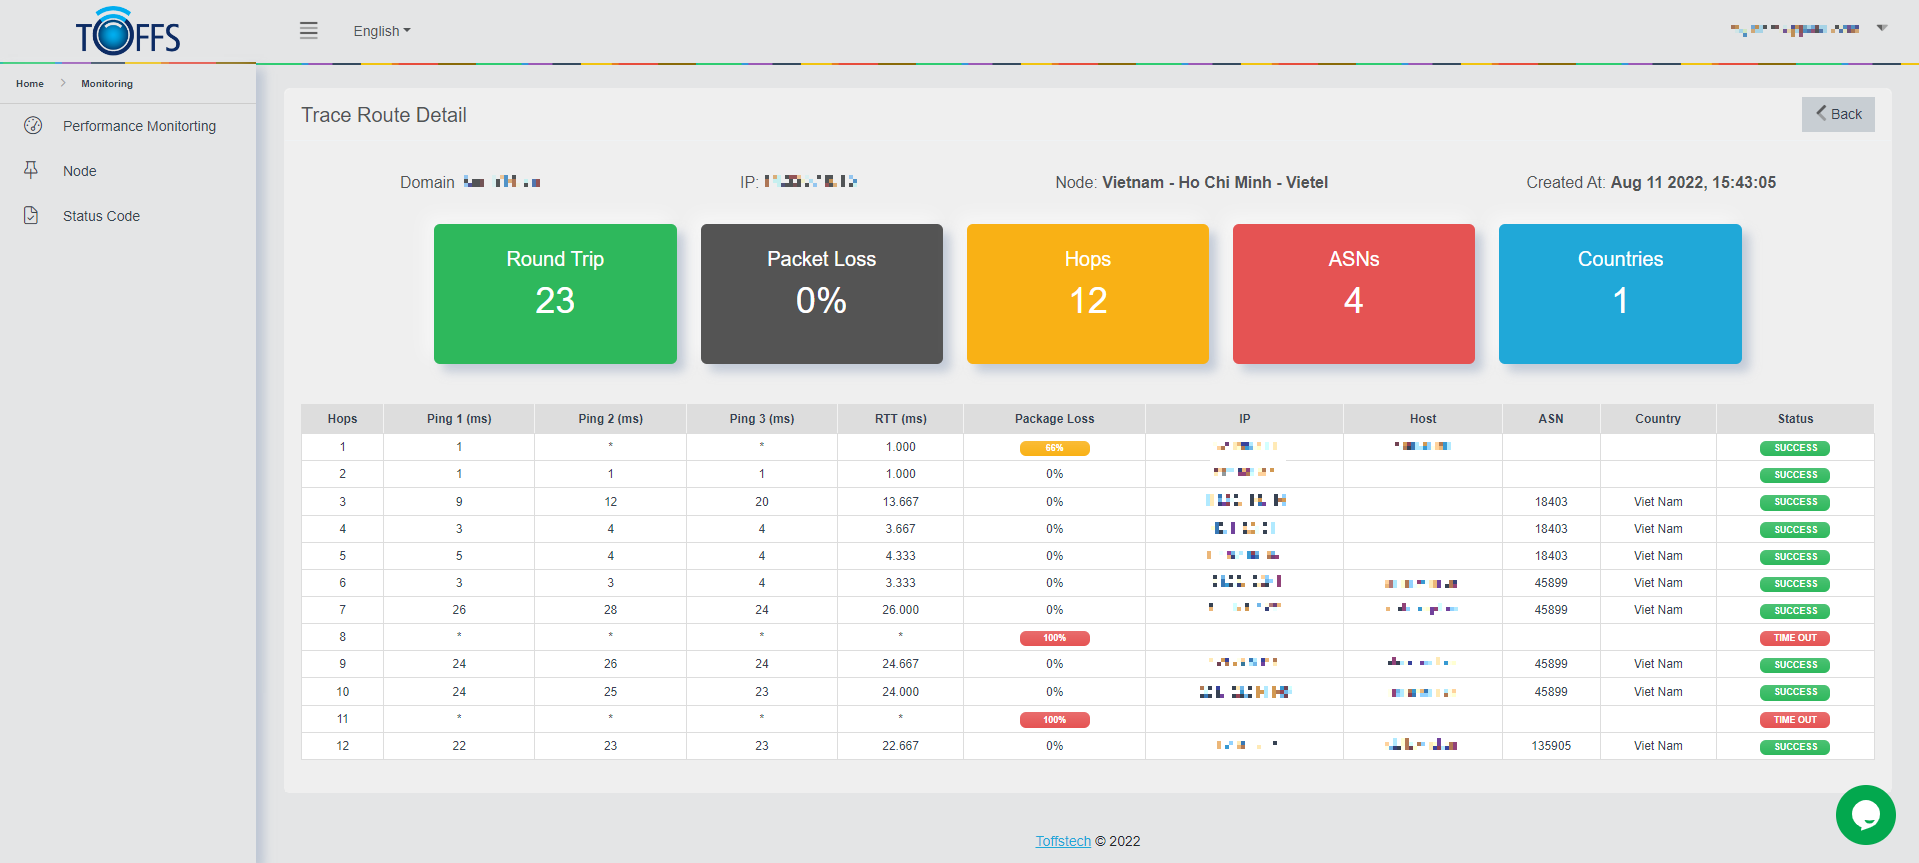
Figure 263
This is the “Trace Route Details” page.
This page allows to explore the basic and overview information of a Domain that we want to monitor. The information includes details about the Domain itself, its IP address, the Node it’s connected to, the Run Time, Round Trip Time (RTT), Packet Loss, Hops, ASNs (Autonomous System Numbers), and the Countries involved.
Let’s begin by understanding the key performance metrics displayed in the table:
-
Hops: Think of Hops as the journey from your computer to the destination computer. It’s the series of intermediate nodes that the data packets traverse to reach their final destination.
-
Ping: Ping is a test that measures how fast a data signal can travel from your computer to another location, usually a website. It helps assess the latency or delay in the communication between the two points.
-
RTT (Round Trip Time): RTT represents the average time in milliseconds (ms) for three pings to travel from your computer to the destination and back. It gives us an idea of the overall network responsiveness.
-
Packet Loss: Packet Loss indicates the percentage of data packets that fail to reach their destination at a particular hop. Higher packet loss can lead to degraded performance.
-
IP (Internet Protocol) Address: Each computer on the trace route is identified by a unique IP address, which is a nine-digit number separated by periods. It helps in identifying the individual network connection of each computer.
-
Host: The Host refers to the name of a router along the trace route. It plays a crucial role in forwarding data packets towards their destination.
-
ASN (Autonomous System Number): ASN is a unique number assigned to each router. It helps in identifying the autonomous system to which the router belongs.
-
Country: This indicates the country where the router is located. It gives valuable insight into the geographical distribution of network infrastructure.
-
Status: The Status column shows the outcome of each hop. It displays whether the hop was successful or if it encountered a time-out.
By analyzing the performance view provided in the table, we can gain valuable insights into the network’s health and pinpoint potential issues. Understanding these metrics is essential for effectively monitoring and troubleshooting network connections. Now that you are familiar with the key concepts and information presented on the “Trace Route Details” page, you can confidently analyze and interpret the performance data for any domain you wish to monitor.
Edit Trace Route Mode
On the List Performance Monitoring page, simply click on the “Edit” symbol button located next to the Trace Route item that requires modification.
Web
Add Web Mode Test
In this section, you will learn how to view the Performance Monitoring of Web Mode. Follow these steps to get started:
Step 1: Access the List Performance Monitoring Page
Go to the List Performance Monitoring page, and you will see a list of existing performance monitoring configurations.
Step 2: Add a New Monitoring
Click the “+Add” button located on the List Performance Monitoring page. This will allow you to create a new monitoring configuration.
Step 3: Configure the Monitoring Settings
- Select the “Customer” for whom you want to set up the performance monitoring.
- Enable the status of this monitoring to activate it.
- Provide a unique “Name” for this monitoring configuration.
- Choose “Web” Mode from the available options.
- Optionally, set a new value in the “Frequency” field to adjust the monitoring frequency.
- Provide the “URL” of the website or web application you want to monitor.
- Select the preferred “Method” for monitoring, such as GET or POST.
- Choose the desired “Nodes” from which you want to monitor the website.
Step 4: Set the Timeframe and Time Zone
- In the “Time From” and “Time To” fields, select the time range for which you want to perform monitoring.
- Choose a suitable “Time Zone” for accurate time-based monitoring.
Step 5: Optionally Add Headers
If required, you can add custom headers to the monitoring request by clicking “Add Header”.
Step 6: Configure Alerts
- Continue to configure alerts by clicking on the “Add Alerts” option. This will allow you to set up notifications based on specific conditions or thresholds.
- If you don’t want to receive alert emails, you can disable the alert function by turning off the “Inherit & Add Alerts” option.
Step 7: Save the Configuration
Click the “Save” button to save and apply the performance monitoring configuration.
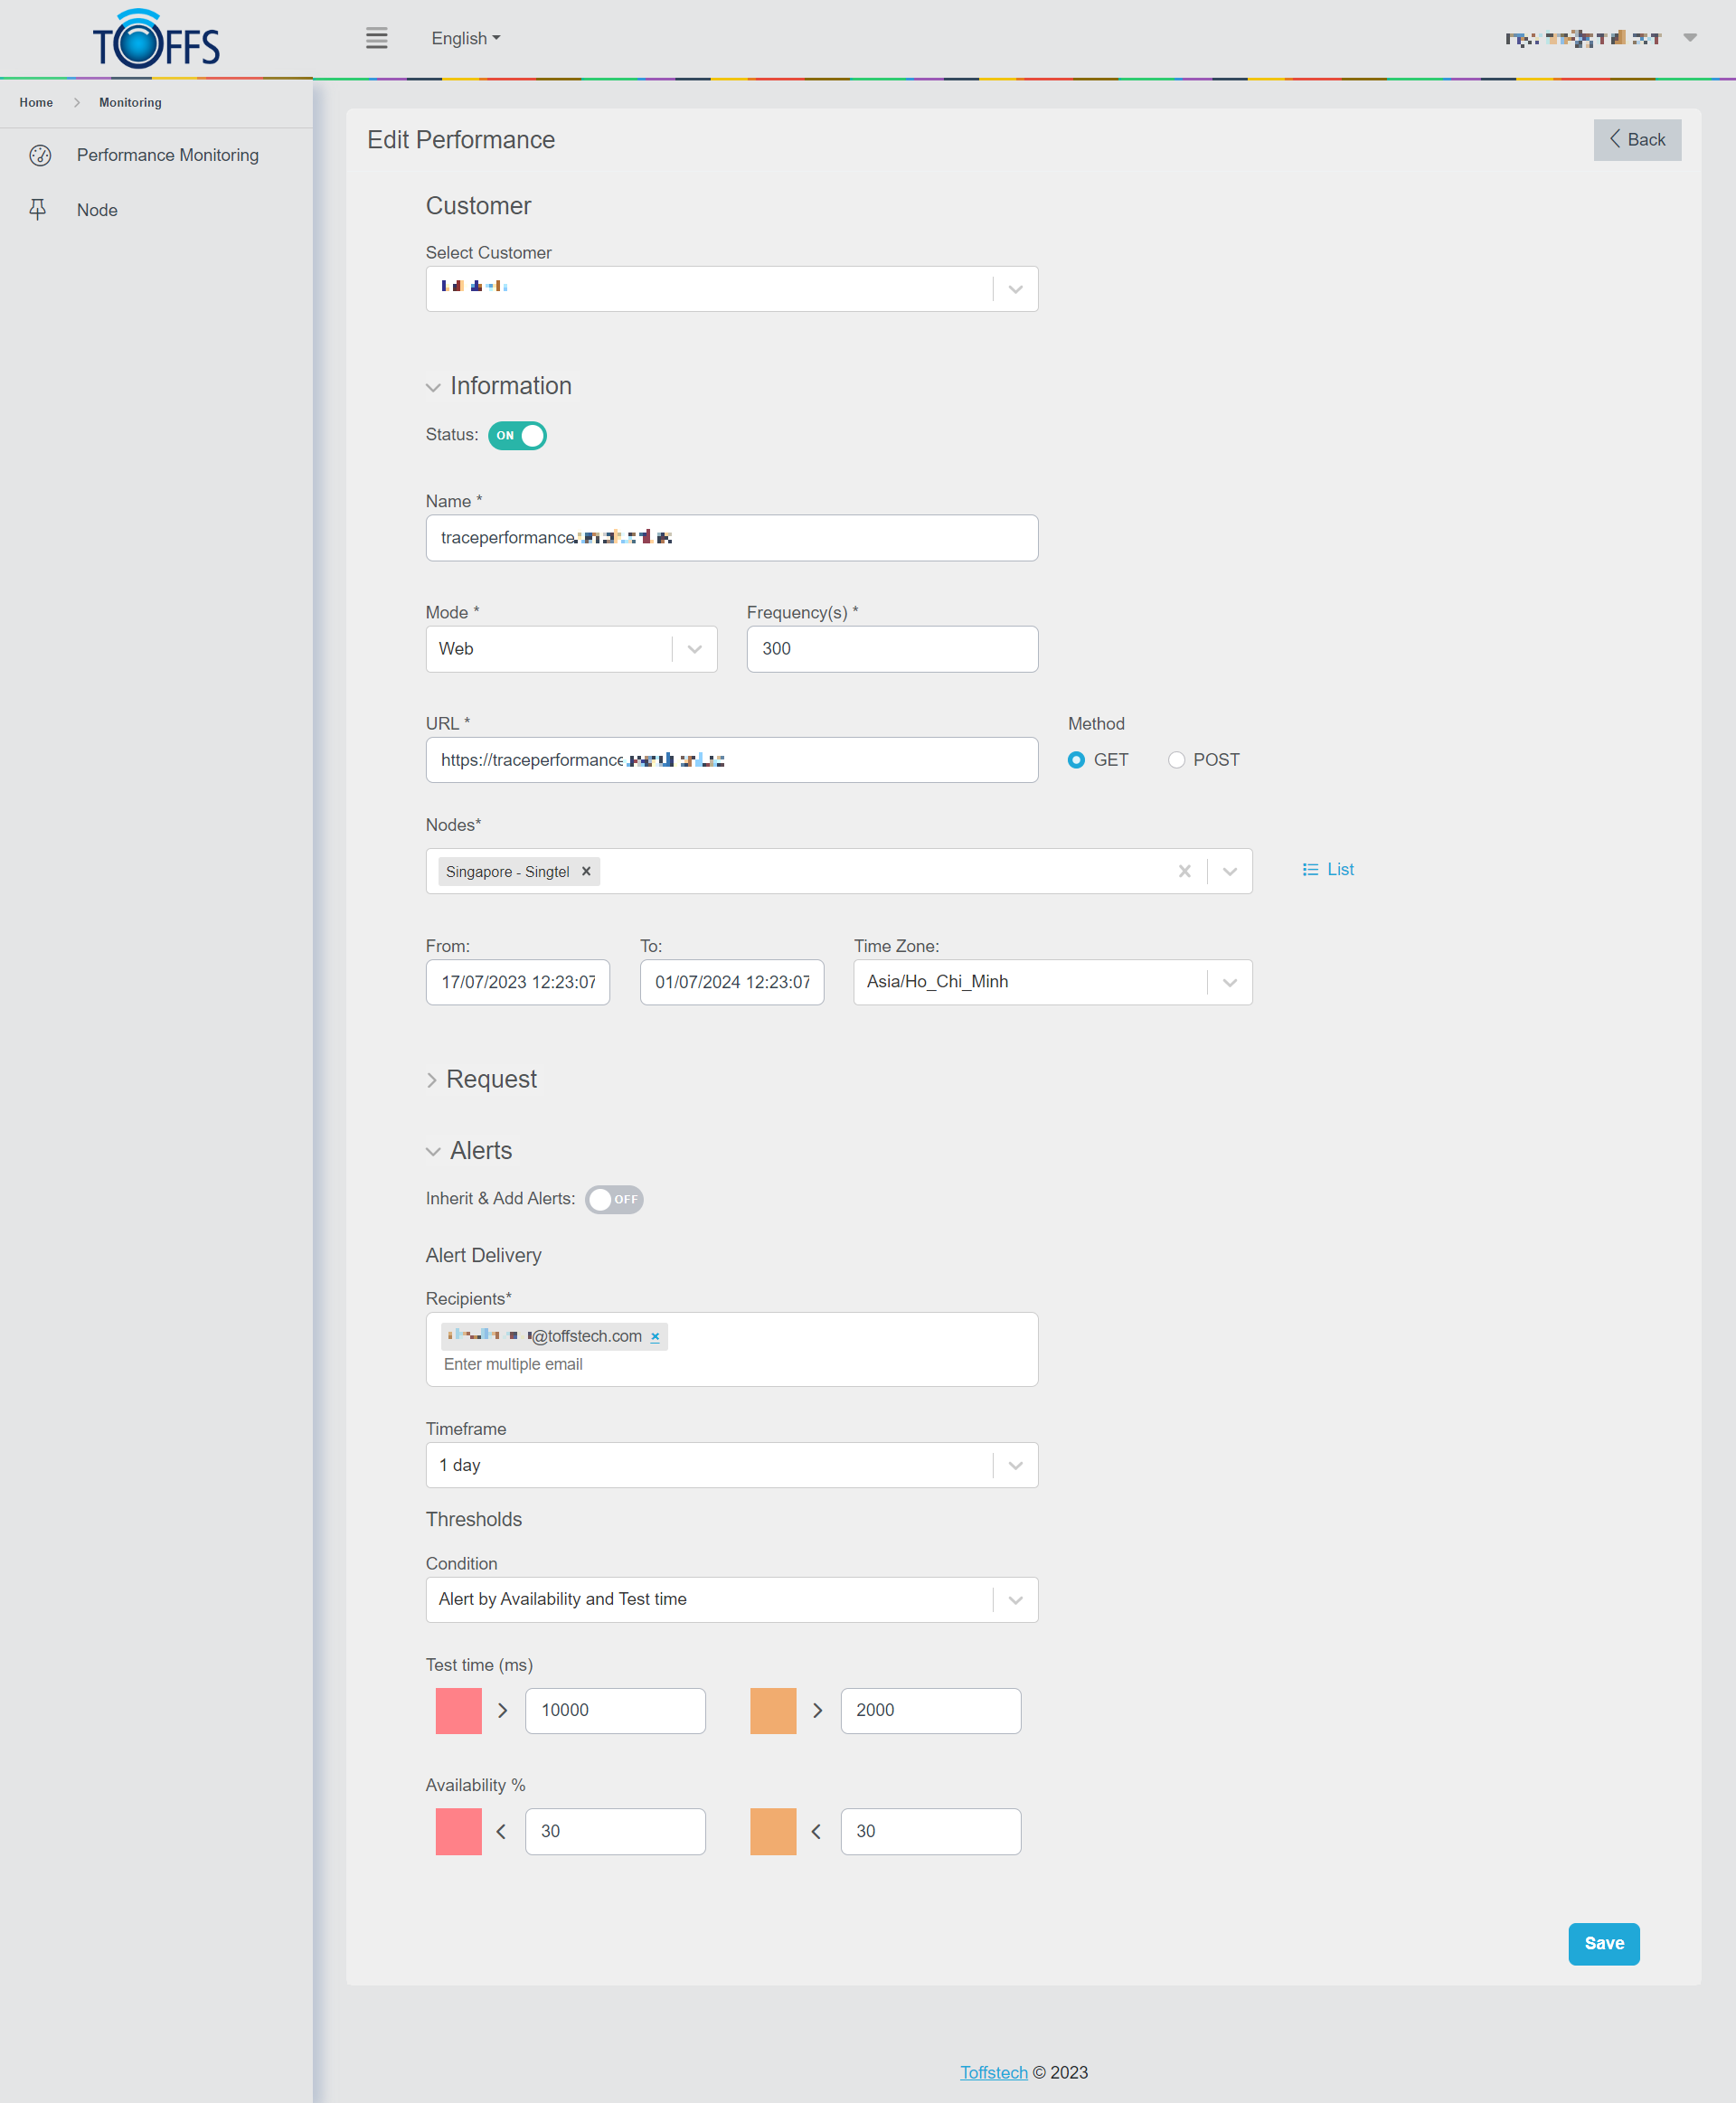
Figure 264- Demo Data for Web Testing Mode
Note:
- Please note that it may take a few minutes for the results to be displayed.
- The system will perform monitoring according to the selected “Time Zone” and the time range specified in the “Time From” and “Time To” fields.
- The response time will be visually indicated using blue, yellow, or red colors based on the configuration in the Alerts section.
You have successfully set up and configured Performance Monitoring in Web Mode. Now, you can keep track of your website’s performance and receive alerts whenever necessary.
Check Performance Monitoring of Web Mode Test
Summary
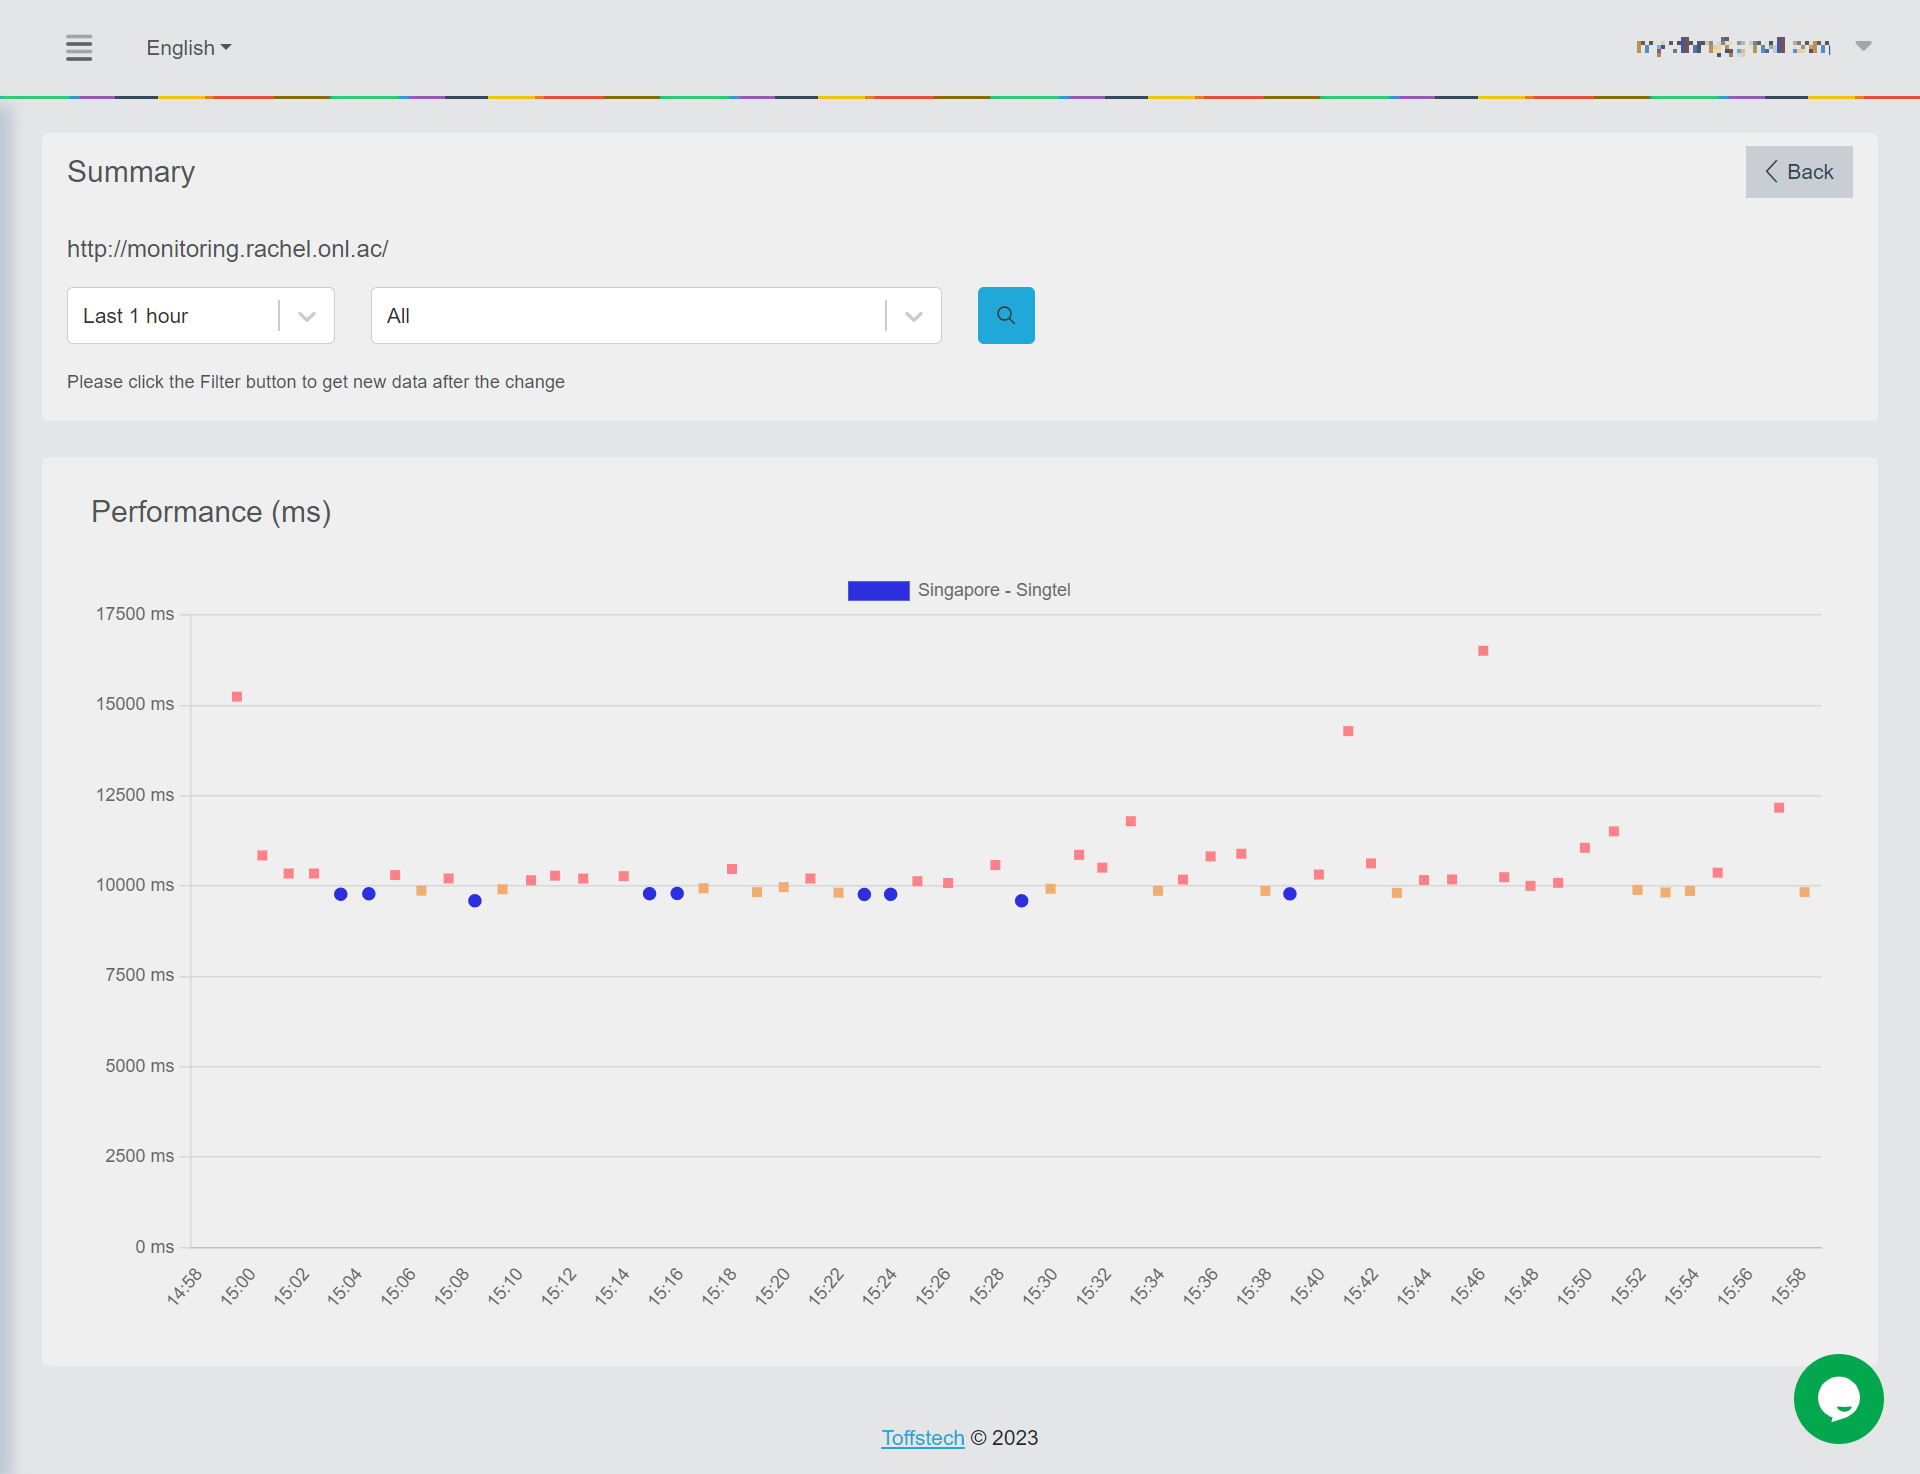
Figure 265
This is the “Summary” page of “Web” mode. This page becomes visible when you click on the “View” icon at the “List Performance Monitoring” page. Here, you can access a comprehensive breakdown of a website’s performance, which includes two key metrics: Webpage Response (measured in milliseconds - ms) and Recorded Time (represented by dots).
Let’s understand the color-coded dots that you’ll encounter on this page:
-
Blue dot: This dot appears when the Webpage Response falls below the Warning range specified in the Test Time field.
-
Yellow dot: On the other hand, the yellow dot comes into view when the Webpage Response exceeds the Warning range set in the Test Time field.
-
Red dot: The red dot becomes visible when the Webpage Response surpasses the Danger range defined in the Test Time field.
Using the drop-down column, you have the option to filter and view detailed information specific to a particular Time and Node.
To delve deeper into the performance details of a specific record, simply click on the corresponding dot, and you will be automatically redirected to the “Waterfall” page.
Waterfall
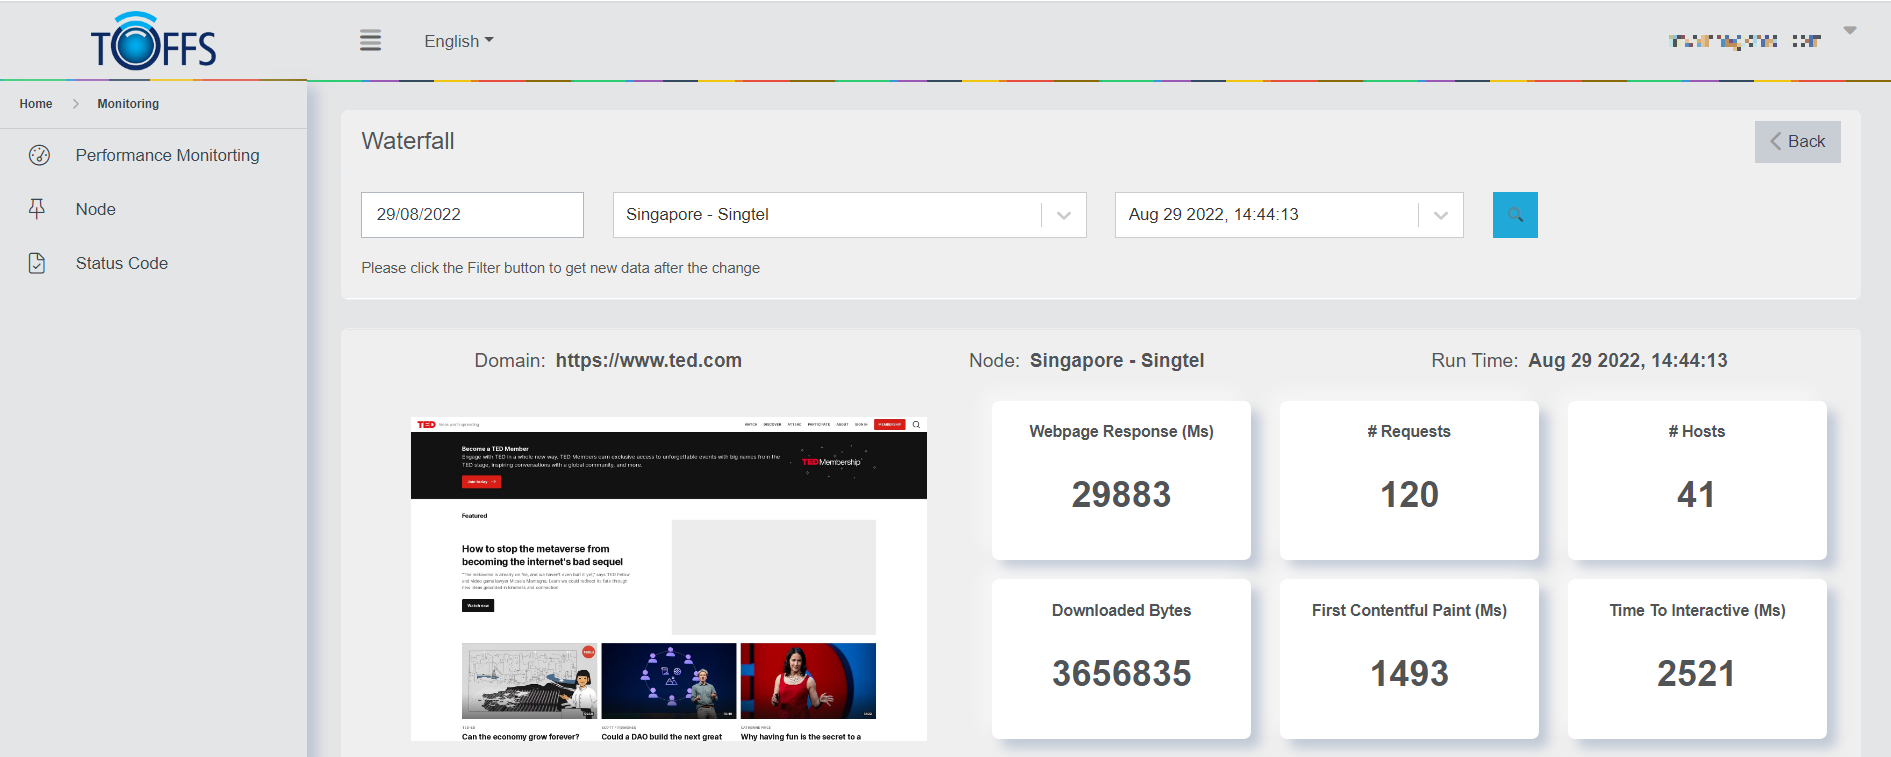
Figure 266
This is the “Waterfall” page of “Web” mode.
This page becomes visible when you click on the dot located on the previous “Summary” page. Here, you’ll find an in-depth performance view of a single web page, which includes essential parameters like the website address, user interface details, and performance metrics.
Let’s go over the key metrics displayed on this page:
-
Webpage Response: This indicates the total timeout for the request made to the web page.
-
Requests: Here, you can see the total number of requests made while loading the web page.
-
Hosts: This shows the total number of hosts that were requested during the page loading process.
-
Downloaded Bytes: The total number of bytes downloaded to load the entire web page.
-
First Contentful Paint (Ms): This measures the time taken by the browser to render the initial part of the web page content.
-
Time to Interactive (Ms): This metric reflects the amount of time it takes for the website to become fully interactive.
In Figure 266, you can see a visual representation of the data for easier comprehension.
Furthermore, there’s a search tool available that allows you to quickly find specific information and parameters related to File Name, Host, IP, HTTP Method, Response Code, Protocol, and Content Encoding, DNS.
In the drop-down column, you have the option to filter detailed information based on specific File Types, Requests, and Zones, which can be helpful for narrowing down your analysis.
By using these features, you can gain valuable insights into the performance of your web page and identify areas for improvement.
Edit Web Mode Test
To Edit Web Mode Tests in List Performance Monitoring, follow these steps:
Step 1: Access List Performance Monitoring
To begin editing Web mode tests, navigate to the List Performance Monitoring page on your preferred platform.
Step 2: Locate the Web Item
Identify the specific Web item that requires editing. Look for the “Edit” symbol button placed next to the particular item you wish to modify.
Step 3: Click the “Edit” Button
Once you have located the “Edit” symbol button next to the desired Web item, click on it to initiate the editing process.
Step 4: Make the Necessary Changes
A new window or interface will likely appear, allowing you to make the necessary adjustments to the Web mode test. Proceed to update the settings, configurations, or any other relevant information as required.
Step 5: Save the Changes
After making the desired modifications, remember to save your changes to ensure they take effect.
You have successfully edited the Web mode test in List Performance Monitoring. Repeat these steps for any other Web items you wish to modify.
Transactions
Add Transactions Mode Test
This feature allows you to monitor the performance of transactions and analyze their behavior. To get started, follow the steps below:
Step 1: Accessing List Performance Monitoring Page
Go to the List Performance Monitoring page in your application or platform.
Step 2: Adding a New Performance Monitoring
On the List Performance Monitoring page, locate and click on the “+Add” button to create a new monitoring entry.
Step 3: Configuring the Monitoring Settings
- In the new monitoring entry, select the “Customer” for whom you want to monitor the performance.
- Enable the status of this monitoring to activate it.
- Provide a suitable name for this monitoring entry to identify it easily.
- Select the “Transaction” mode, as we want to monitor transactions specifically.
- Optionally, you can specify the “Frequency” value to determine how often the monitoring should take place.
Step 4: Recording the Script
In the monitoring settings, there will be a field to provide a script. Here, you need to record the script using the catchpoint extension. Copy this script and paste in the Scirpt field to monitor the transaction.
Step 5: Selecting Nodes and Time Settings
Choose the nodes or locations from where you want to monitor the transactions. Specify the time range for monitoring by setting the “Time in From” and “Time in To” fields. Also, choose the desired time zone for accurate monitoring results.
Step 6: Optionally Adding Headers
If required, you can include additional headers by clicking on the “Add Header” option. This will provide more context to the monitoring process.
Step 7: Configuring Alerts
To set up alerts, click on the “Add Alerts” button. Enter the configuration details for the alerts. You can set up different thresholds for response times that trigger alerts in the form of blue, yellow, or red indicators based on the configuration specified in the Alerts section.
Step 8: Disabling Alert Function (Optional)
If you do not wish to receive alert emails, you can disable the Alert function by switch to OFF on the “Inherit & Add Alerts” toggle.
Step 9: Saving the Monitoring Configuration
Once you have completed all the necessary configurations, click on the “Save” button to finalize and save the monitoring settings.
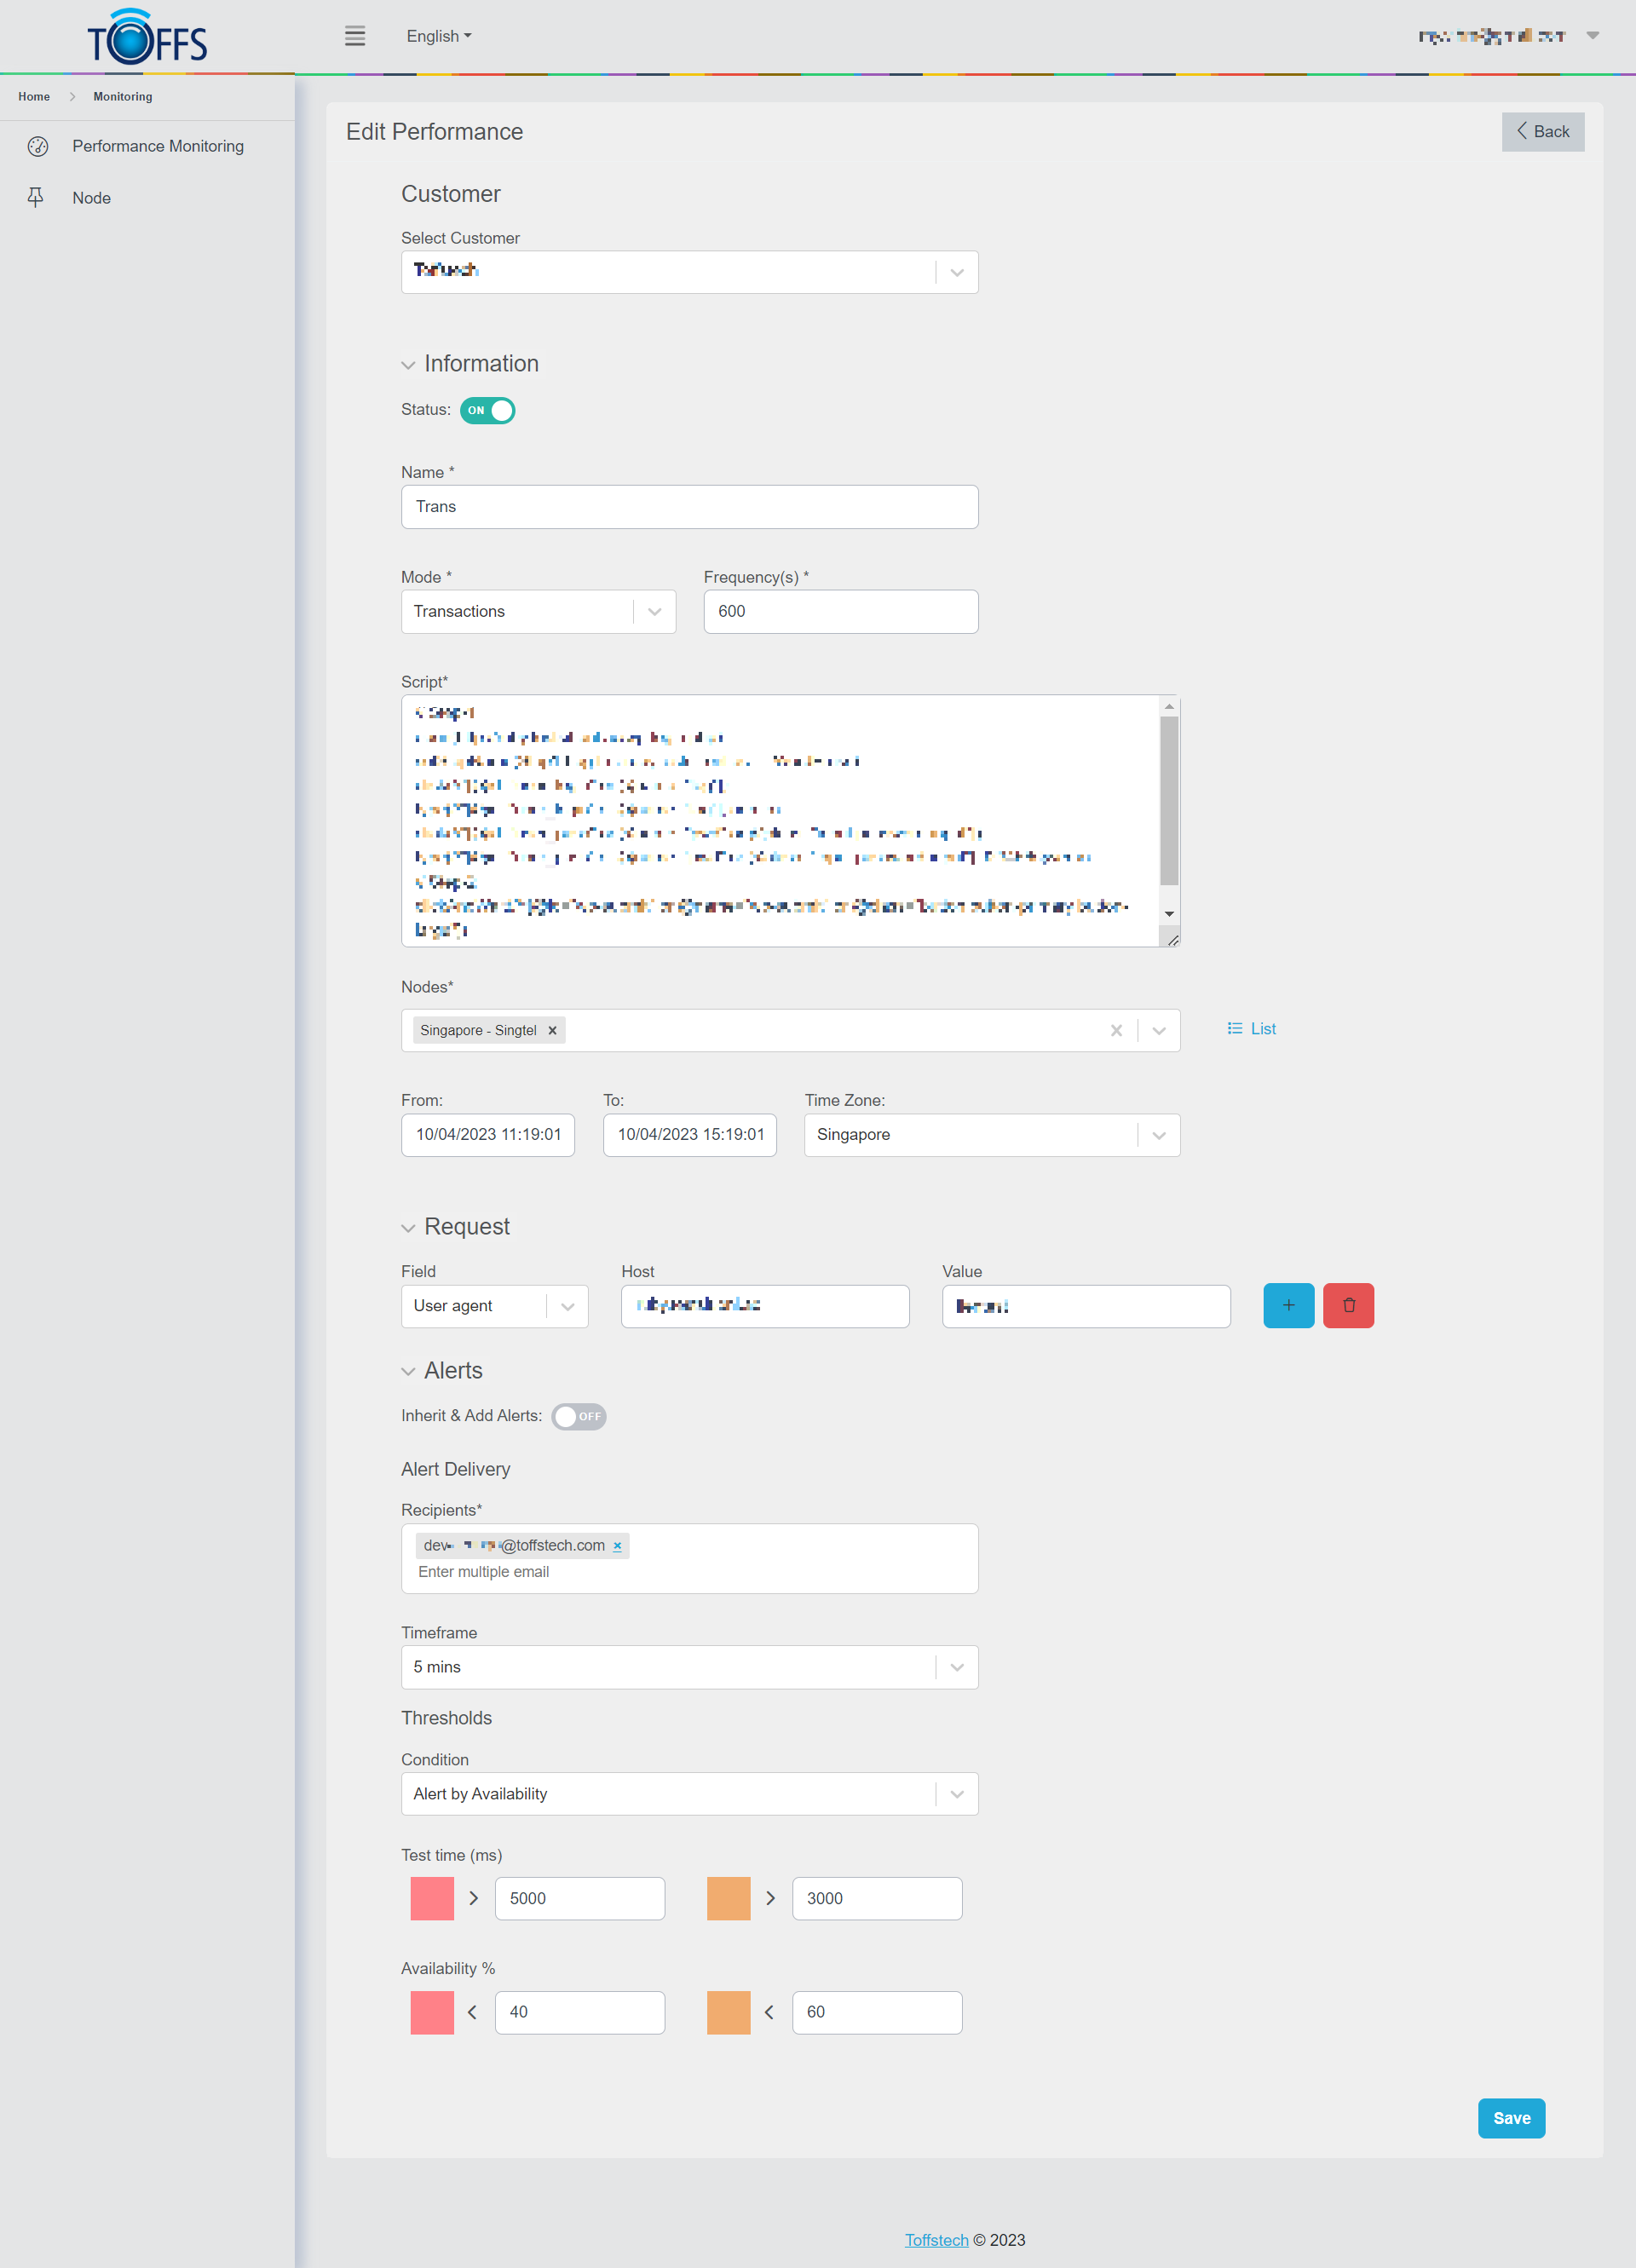
Figure 267 - Demo Data for Web Testing Mode
The system will process the monitoring configurations, and it may take a few minutes for the results to be displayed.
Tips:
-
Remember that the system will monitor transactions according to the specified Time Zone and the time range selected in the “From” and “To” fields.
-
The system will display response times using blue, yellow, or red colors based on the alert configuration specified in the Alerts section.
You have now successfully set up Performance Monitoring of Transactions Mode and can keep track of transaction performance efficiently.
Check Performance Monitoring of Transactions Mode Test
Summary
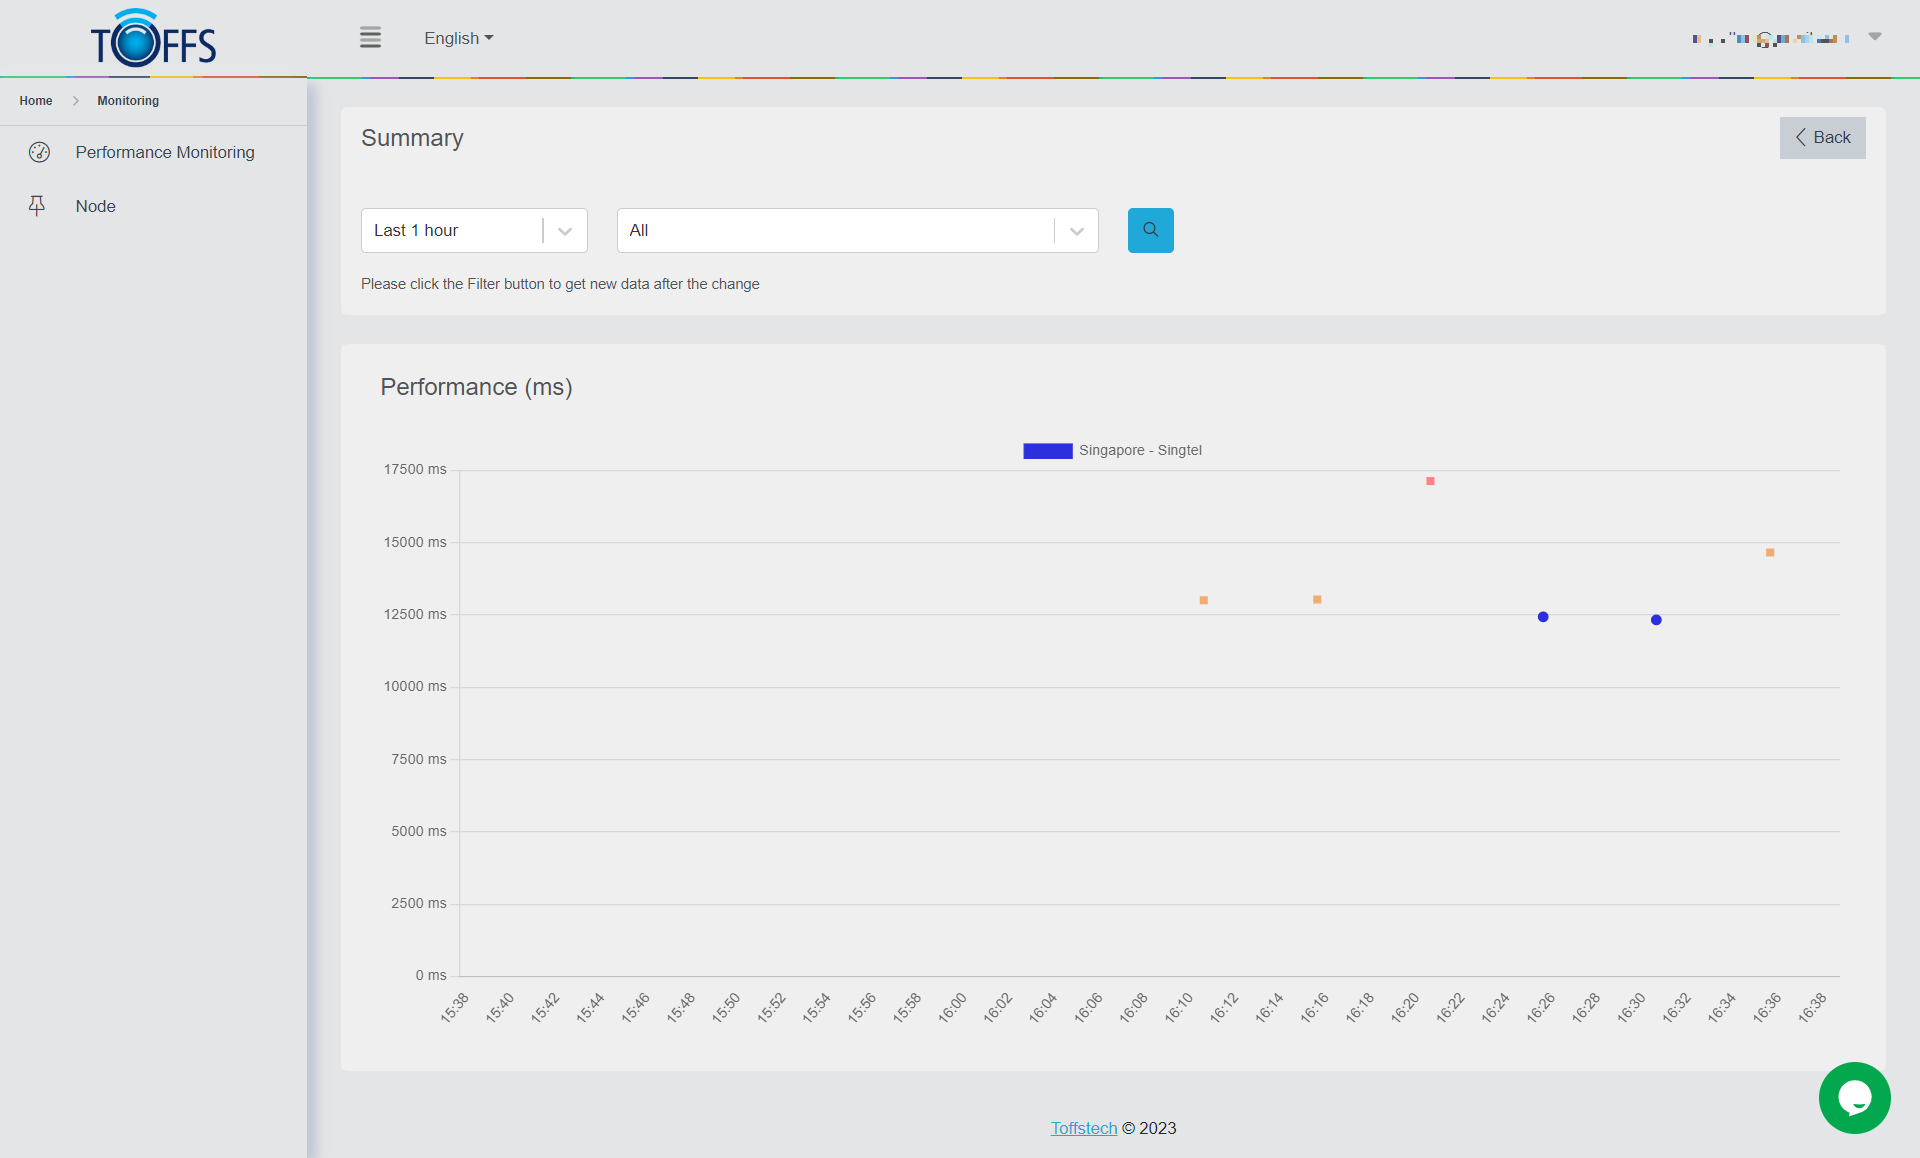
Figure 268
This is the “Summary” page of “Transactions” mode. This page can be accessed by clicking on the “View” icon located on the “List Performance Monitoring” page.
Here, you’ll find a comprehensive breakdown of a website’s performance in Transaction mode. The performance is measured in two key metrics: Webpage Response time in milliseconds (ms) and Recorded Time, which is expressed through different colored dots. Let’s understand the meaning of each dot color:
-
Blue Dot: This dot appears when the Webpage Response time falls below the Warning range specified in the Test Time field.
-
Yellow Dot: On the other hand, a Yellow dot appears when the Webpage Response time exceeds the Warning range set in the Test Time field.
-
Red Dot: Lastly, a Red dot is displayed when the Webpage Response time surpasses the Danger range defined in the Test Time field.
To filter detailed information for specific Time and Node, you can make use of the options available in the drop-down column. This allows you to focus on particular data points of interest.
For a more in-depth view of performance details at a specific record, simply click on the corresponding dot. Doing so will automatically redirect you to the “Waterfall” page, where you can gain further insights into the website’s performance during that specific transaction.
Waterfall
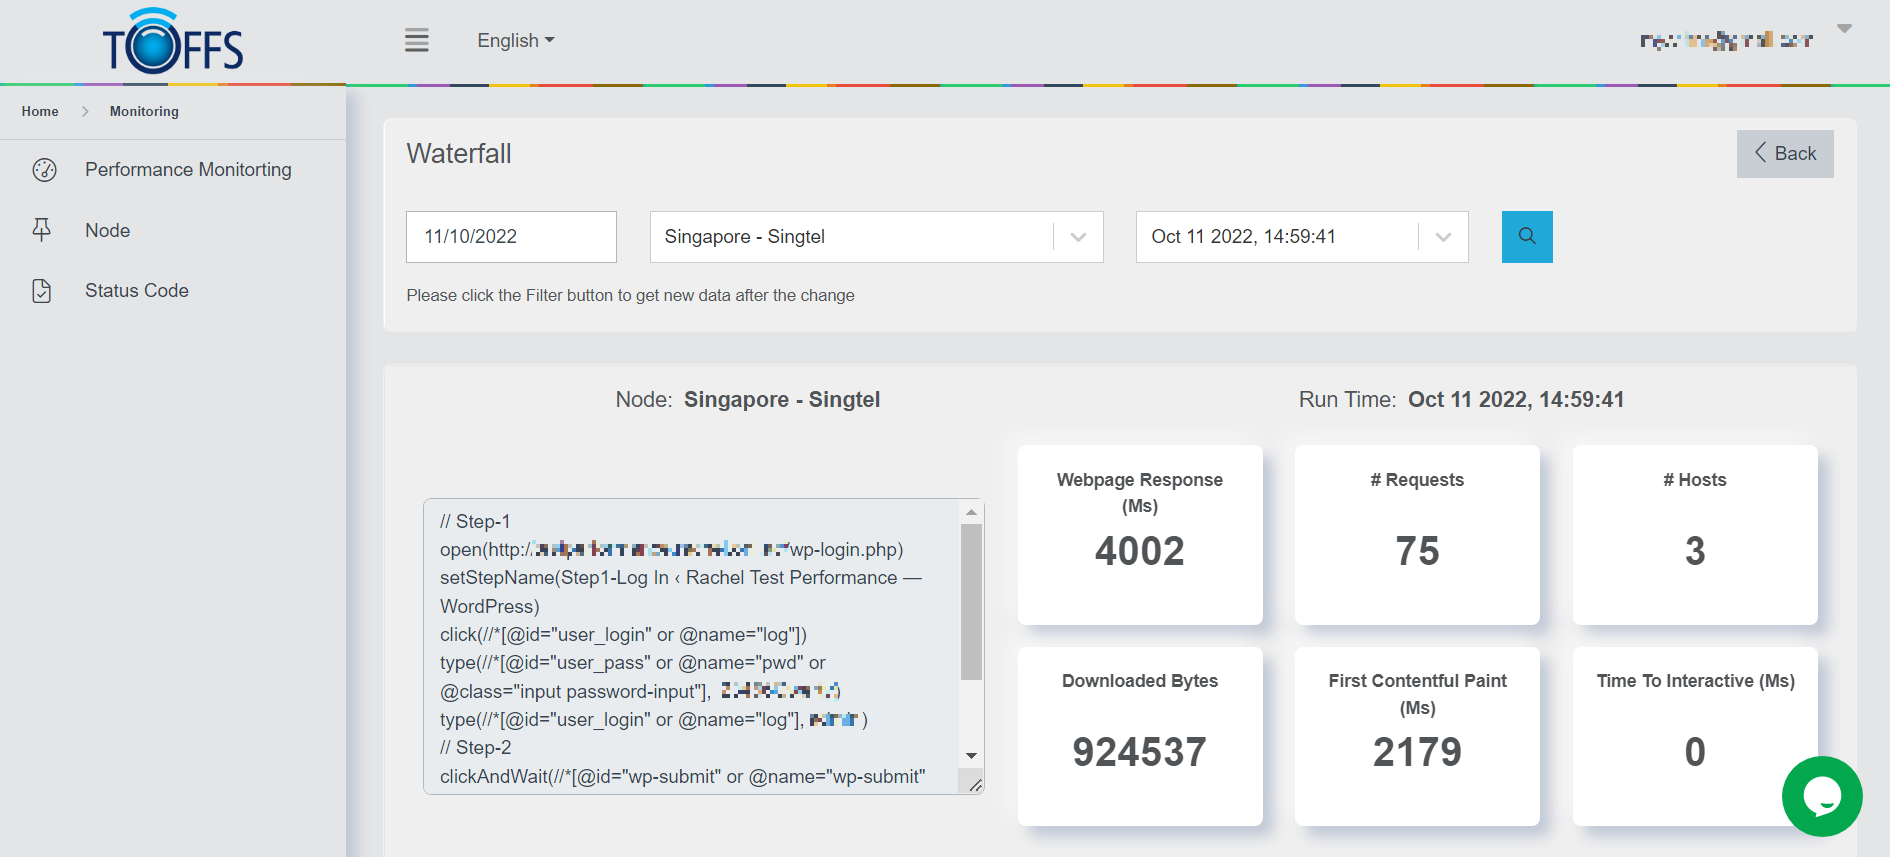
Figure 269
This is the “Waterfall” page of “Transactions” mode. This page becomes visible when you click on the dot available on the previous “Summary” page.
Here, we’ll be diving into an in-depth performance view of a single page, presenting essential data, including the website address, user interface, and various performance parameters that have been recorded. Let’s explore the key metrics displayed on this page:
-
Webpage Response: This indicates the total timeout for the request, giving you insights into how responsive the webpage is.
-
Requests: This shows the total number of requests made by the webpage to fetch different resources.
-
Hosts: Here, you’ll find the total count of hosts that were requested while loading the webpage.
-
Downloaded Bytes: This represents the total number of bytes downloaded to load the entire webpage.
-
First Contentful Paint (Ms): This metric measures the time it takes for the browser to render the initial part of the web page content, providing a glimpse of when the page starts to become visible to the user.
-
Time to Interactive (Ms): This crucial metric indicates the time it takes for the website to become fully interactive, allowing users to interact with its elements.
Now, let’s take a look at Figure 269
The search tool on this page is a handy feature that enables you to quickly find specific information and parameters related to File Name, Host, IP, HTTP Method, Response Code, Protocol, and Content Encoding, as recorded during the webpage’s loading process.
The drop-down column offers you the option to filter the displayed information based on specific File Types, Requests, and Zones, providing you with a more detailed and tailored view.
With this comprehensive overview, you can analyze the performance of your webpage more effectively and make informed decisions to optimize its loading speed and user experience.
Edit Transactions Mode
To edit transactions on the List Performance Monitoring page, just follow these simple instructions:
Step 1: Navigate to the List Performance Monitoring Page
First, ensure that you are on the List Performance Monitoring page. If you’re not there yet, locate and click on the appropriate menu option or link to access this page.
Step 2: Locate the “Edit” Symbol Button
On the List Performance Monitoring page, you will see a list of transactions. Each transaction will have an “Edit” symbol button located next to it.
Step 3: Choose the Transaction to Edit
Identify the transaction that you wish to edit. Once you’ve found the specific transaction you want to modify, click on the corresponding “Edit” symbol button next to it.
Step 4: Make the Necessary Edits
After clicking the “Edit” symbol button, you will be directed to the editing mode for that particular transaction. Here, you can make any changes or updates to the transaction details as needed.
Step 5: Save your Edits
Once you have finished editing the transaction, remember to save your changes. Look for a “Save” or “Update” button on the editing interface, and click it to apply your modifications.
Please contact Toffs Security Operation Center for assistance if you encounter any issues.